
Page 172 - 2018_11-Haematologica-web
P. 172
M. Pollari et al.
AB
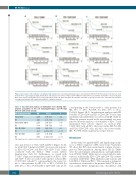
C
Figure 2. Association of the immune cell subtypes with survival. (A-C) Cell immunophenotypes were determined by mIHC from 74 PTL patients. Patients were strat- ified into three equal subgroups (high, intermediate and low) based on tertiles of PD-L1+CD68+ TAM, PD-1+CD3+CD4+ T cell, and PD-1+CD3+CD8+ T-cell counts. Kaplan- Meier plots depict survival differences between the PD-L1+CD68+ (A), PD-1+CD3+CD4+ (B), and PD-1+CD3+CD8+ (C) groups. P-values were determined by univariate Cox regression analysis (HR, hazard ratio with 95% confidence interval).
Table 4. Cox regression analysis at multivariate level showing inde- pendent association of low cell immunophenotypes and IPI high (IPI 3-5) with overall survival.
corresponding to the lowest tertile vs. other patients; 5-y OS, 39% vs. 65%, P=0.008; 5-y DSS, 43% vs. 81%, P<0.001; Figures 2B-C). In multivariate analyses with IPI, both PD-1+CD3+CD4+ and PD-1+CD3+CD8+ T-cell counts maintained an independent association with OS (Table 4). When the patients treated in the pre-rituximab era were removed from the analyses, a low number of PD-1+ T cells maintained their adverse impact on survival (PD- 1+CD3+CD4+ cells, ≤8.50%, the lowest tertile; OS, P=0.001 and PD-1+CD3+CD8+ cells, ≤11.02%, the lowest tertile; OS, P=0.034; Online Supplementary Figure S2B-C).
Discussion
In this study, we applied mIHC and digital image analy- sis to a TMA comprised of PTL tissue from 74 patients. We show that PTL microenvironment contains a hetero- geneous TAM population. Among these, PD-L1+ TAMs were the predominant subpopulation, and high infiltra- tion of PD-L1+CD68+ TAMs was associated with favorable survival. Additionally, PD-1+ CD4+ and CD8+ TIL contents correlated with PD-L1+ TAM infiltration and survival, and both PD-L1+ TAMs and PD-1+ TILs emerged as independ- ent indicators of survival for the patients with PTL. In con- trast, neither PD-L1+ lymphoma cells, other PD-L1+ cells
Cell immunophenotype
PD-L1+CD68+
HRa 95% CI
2.214 1.054-4.650
P
0.036
4.325 2.008-9.312 2.275 1.054-4.909 3.608 1.643-7.923 2.654 1.261-5.586 4.907 2.275-10.585 2.259 1.075-4.748 4.971 2.314-10.678
IPI
PD-L1+CD68+/CD68+
IPI
PD-1+CD3+CD4+
IPI
PD-1+CD3+CD8+
IPI
aHR, hazard ratio; CI: confidence interval; IPI: International Prognostic Index.
<0.001 0.036 0.001 0.010 <0.001 0.031 <0.001
ence and absence of CD4, CD8 and PD-1 (Figure 1C-D). As with CD4+ T-helper and CD8+ cytotoxic cells in gener- al, PD-1+CD3+CD4+ and PD-1+CD3+CD8+ T-cell counts correlated with the PD-L1+ TAM counts (Online Supplementary Table S2). Furthermore, as overall with T-cells,25 a high and intermediate number of PD-1+ CD4+ and CD8+ T-cells associated with superior survival (PD- 1+CD3+CD4+ cells ≤5.7% corresponding to the lowest ter- tile vs. other patients; 5-y OS, 34% vs. 68%, P=0.002; 5-y DSS, 43% vs. 81%, P<0.001; PD-1+CD3+CD8+ cells, ≤7.2%
1912
haematologica | 2018; 103(11)
