
Page 170 - 2018_11-Haematologica-web
P. 170
M. Pollari et al.
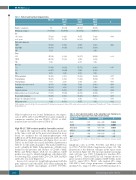
Table 1. Patient and treatment characteristics.
All n (%)
PD-L1+ CD68+ low
25 (34)
68 (38-86)
6 (24) 19 (76)
GCBa
Non-GCB
NA 1(1) 1(4)
Stage
I-II 47 (64) 10 (40) 16 (67) 21 (84) III-IV 24 (32) 15 (60) 6 (25) 3 (12) NA 3(4) 2(8) 1(4)
Number of patients
Median age (range) Age
<60, years ≥ 60, years
Molecular subgroup
74
70 (36-92)
17 (23) 57 (77)
PD-L1+
CD68+ intermed.
24 (32)
73 (37-92)
4 (17) 20 (83)
PD-L1+ CD68+ high
25 (34)
66 (46-90)
7 (28) 18 (72)
P
0.638
0.426
0.002
0.065
0.137 0.057 0.856 0.464 0.136 0.884 0.305 0.237 0.377 0.312
17 (23) 56 (76)
8 (32) 17 (68)
4 (17) 20 (83)
5 (20) 19 (76)
IPI score
0-2 3-5 NA
CNS prophylaxis IV prophylaxis IT prophylaxis
Contralateral testis treated
Irradiation
Surgical excision
Anthracycline-based chemotherapy
Treated with rituximab
Relapse of contralateral testis
CNS progression
50 (68) 13 (52) 17 (71) 20 (80) 20 (27) 11 (44) 5 (21) 4 (16) 4(5) 1(4) 2(8) 1(4)
36 (49) 34 (46) 7 (9) 23 (31) 12 (16) 11 (15) 60 (81) 35 (47) 1 (1)
9 (12)
9 (36) 8 (32) 2 (8) 6 (24) 2 (8) 4 (16) 18 (72) 9 (36) 0 (0)
4 (16)
11 (46) 10 (42) 3 (13) 7 (29) 3 (13) 4 (17) 21 (88) 11 (46) 1 (4) 4 (17)
16 (64) 16 (64) 2 (8) 10 (40) 7 (28) 3 (12) 21 (84) 15 (60) 0 (0) 1 (4)
aGCB: germinal center B-cell like; NA: not applicable; IPI: International prognostic Index; CNS: central nervous system; IV: intravenous; IT: intrathecal; P: P-value determined by Kruskal-Wallis test.
MS4A1 expression was found. Furthermore, the expres- sion of CD68, CD274 and PDCD1LG2 genes analyzed as continuous variables, but not PDCD1, CD163 or MAF, translated into favorable survival (Table 2).
High PD-L1+ TAM content predicts favorable survival
To explore the expression of the checkpoint molecules in the tumor cells and in the microenvironment in more detail, we analyzed the cell immunophenotypes with mIHC from a PTL TMA using four primary antibodies and DAPI (nuclear stain) simultaneously (Figure 1A-C; see also Table 1 for the TMA cohort used and Online Supplementary Table S1 for the antibody panels). The marker CD68 was used to identify all TAMs. Subpopulations of TAMs were defined by the presence and absence of CD163, c-MAF, PD-L1 and PD-L2 (Figure 1A-B, D). In addition, CD20 marker was used to identify lymphoma cells (Figure 1B). For detecting TILs, a panel with CD3, CD4, CD8, and PD1 antibodies was used (Figure 1C).
As proof of concept, we found high agreement with the gene expression and the mIHC data when analyzing the quantities of CD68+ macrophages (rs=0.637, P<0.001),
Table 2. Cox regression analysis at the univariate level showing asso- ciation of gene expression levels with overall survival.
Gene symbol
CD68
CD274 PDCD1LG2 PDCD1 CD163 MAF
HRa 95% CI
0.505 0.290-0.881
0.737 0.592-0.919
0.688 0.505-0.936
0.846 0.659-1.088
0.914 0.636-1.313
0.899 0.551-1.466
P
0.016
0.007
0.017
0.192
0.627
0.668
aHR: hazard ratio; CI: confidence interval. Boldface font indicates statistical signifi- cance (P<0.05).
lymphoma cells (rs=0.704, P<0.001) and PD-L1+ cells (rs=0.710, P<0.001) (Online Supplementary Figure S1). The proportions of the different cell types in the tumor tissue are shown in Figure 1D. The most prominent non-malig- nant cell type was CD3+ T-lymphocyte (median 45%, range 5-97%). TAM and PD-L1+ cell contents showed a great variation between the samples (CD68+ TAMs, medi- an 23%, range 3-81%; PD-L1+ cells, median 15%, range 0.01-100%), and a large proportion of lymphoma cells (median 34%, range 0.1-100%) and TAMs (median 41%,
1910
haematologica | 2018; 103(11)
