
Page 91 - 2018_10-Haematologica-web
P. 91
Everolimus added to consolidation therapy for AML
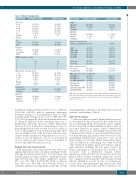
Table 1. Patients’ characteristics.
Characteristic
Age, years 16-29 30-39 40-49 50-59 60+ Median Range
Sex Female Male
Diagnosis
De novo
Secondary MDS
Everolimus (n=220)
33 (15%) 36 (16%) 58 (26%) 73 (33%) 20 (9%) 48
16-69
117 (53%)
103 (47%)
203 (92%) 5 (2%) 12 (5%)
Control (n=112)
16 (14%) 17 (15%) 31 (28%) 37 (33%) 11 (10%) 46
70 (63%)
42 (37%)
103 (92%) 3 (3%) 6 (5%)
Characteristic
NPM1c
Wild type Mutant Unknown
FLT3 TKD Wild type Mutant Unknown
Everolimus (n=220)
132 (65%) 70 (35%) 18
204 (99%) 3 (1%) 13
Control (n=112)
61 (61%) 39 (39%) 12
100 (98%) 2 (2%) 10
7 (6%)
14 (13%) 14 (13%) 14 (13%) 11 (10%) 12 (11%)
19(17%)
21(19%)
11 (10%) 101 (90%)
24 (21%) 24 (21%) 64 (57%)
47 (42%) 38 (34%) 16 (14%) 14 (13%)
Induction chemotherapy
ADE (not randomized) 13 (6%)
ADE ADE+GO3 ADE+GO6 DA+GO3 DA+GO6
WHO performance status 0
29 (13%) 26 (12%) 26 (12%) 22 (10%) 26 (12%)
37(17%)
41(19%)
Risk score after course 1
Good risk 27 (13%) Standard risk 193 (87%)
MRD status after course 1 (CR only)
DA90mg 2 37 19 DA60mg
1 178 88 343
412 White blood cell count, x109/L
0-9.9 10-49.9 50-99.9 100+ Median Range
Cytogenetics Intermediate Unknown
FLT3 ITD Wild/type Mutant Unknown
138 (63%) 61 (28%) 15 (7%) 6 (3%) 5.8 0.4-177.7
194 (88%)
26 (12%)
199 (96%) 8 (4%) 13
65 (58%) 34 (30%) 9 (8%) 4 (4%) 5.5 0.5-249.0
106 (95%)
6 (5%)
101 (99%) 1 (1%) 10
CR, MRD -ve
CR, MRD +ve
No MRD data/no CR
Transplanted
Any allograft
Any transplant in CR1 Allograft in CR1
43 (20%) 63 (29%) 114 (52%)
85 (39%) 69 (31%) 24 (11%) 20 (9%)
months following randomization [8% versus 1%, HR 3.57 (1.36-9.42), P=0.009], with no significant differences thereafter, leading to a non-significant excess of overall mortality with everolimus [11% versus 6%, HR 1.75 (0.83- 3.70), P=0.14] (Figure 4B). In the first 6 months there were 17 deaths in remission in the everolimus arm versus 1 death in the control arm: the causes of these deaths were infection (9 versus 1), infection + hemorrhage (3 versus 0), hemorrhage/cardiovascular accident (3 versus 0), cardiac (1 versus 0) and multiple (1 versus 0). Beyond 6 months, there were six deaths in each of the two arms, with the causes of these deaths in remission being infection (1 versus 1), cardiac (1 versus 0), hepatic (1 versus 0), second cancer (1 versus 0), graft-versus-host disease (0 versus 1), multiple (0 versus 2) and unknown/other (2 versus 2).
Relapse-free and overall survival
Both relapse-free and overall survival rates were non- significantly inferior in the everolimus arm (Figure 4C,D), reflecting the adverse hazard ratios for both relapse and death in remission, with no evidence of differences in sal- vage between arms after relapse [relapse-free survival: 29% versus 40%, HR 1.19 (0.90-1.59), P=0.2; overall sur- vival: 45% versus 58%, HR 1.30 (0.94-1.81), P=0.11]. A sensitivity analysis censoring patients at the time of stem
MDS: myelodysplastic syndrome; WHO: World Health Organization; ITD: internal tan- dem duplication; TKD: tyrosine kinase domain; ADE: Ara-C, daunorubicin, etoposide; GO: gemtuzumab ozogamicin; DA: daunorubicin; CR: complete remission; MRD: min- imal residual disease;
cell transplantation showed results which were consistent with the overall analysis (Table 2).
Exploratory analyses
Correlations with everolimus plasma inhibitory activi- ty, determined by the assay used in this study, did not show convincing patterns. Even patients whose samples showed deep and sustained inhibition did not have an associated reduction in relapse (Online Supplementary Figure S2). There was no relationship between the level of inhibition and toxicity or excess mortality. Prior induc- tion chemotherapy, age, gender, white blood cell count, and minimal residual disease status after course one all had no impact on outcomes (Online Supplementary Figure S4A). In addition no relationship was found between other treatment modalities given and response, and no gene mutation, including the 111 genes assayed by Sanger sequencing in 123 patients, was shown to be associated with a differential response (Online Supplementary Figure S5). Because of concerns about com- pliance with everolimus treatment, relapse-free survival was compared between patients with satisfactory drug delivery (defined as at least 14 days of treatment per course), those with inadequate drug delivery (less than 14 days treatment per course) and those allocated to no
haematologica | 2018; 103(10)
1657
