
Page 90 - 2018_10-Haematologica-web
P. 90
A.K. Burnett et al.
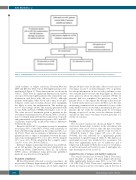
Figure 1. CONSORT diagram. APL: acute promyelocytic leukemia; CEP-701: lestaurtinib; CBF: core-binding factor; MTOR: mammalian target of rapamycin;
ciated evidence of relapse reduction. Between October 2009 and October 2012, 332 of 482 eligible patients were randomized (Figure 1). Their characteristics are shown in Table 1. There were no significant differences in survival outcomes between eligible patients who entered the ran- domization and those who did not (P=0.8), although patients with higher white blood cell counts, worse per- formance status and secondary disease were marginally less likely to enter the randomization. The median age was 47 years (range, 16-69). The majority presented with de novo AML and had a WHO performance score of <2. The other protocol treatments given to patients in the everolimus randomization are shown in Table 1. In addi- tion to standard daunorubicin/Ara-C induction, etoposide and gemtuzumab ozogamicin was given to 43% and 45% of patients, respectively, in induction with no difference between the arms.
Overall, 132/332 (40%) of patients received a transplant (everolimus 39%, control 42%, P=0.6), with a minority of these (34/132) being allografts in first remission (20 versus 14, P=0.3). There was no evidence of differences in trans- plantation rates or types of transplants between the arms (any stem cell transplant 39% versus 42%, P=0.6; allograft 31% versus 34%, P=0.6; allograft in first complete remis- sion 9% versus 13%, P=0.3) (Table 1).
Extensive Sanger sequencing (111 genes) was undertak- en in 123 patients: the gene panel and distribution are shown in Online Supplementary Figure S3. In addition NPM1 status, determined using previously published methods, was known for 302 patients.
Treatment compliance
Of the 220 patients allocated to receive everolimus, 16 never started therapy. Approximately 25% of patients did not receive 14 days of everolimus; about half completed
the first 28-day course. At the time of the second course of everolimus (course 3 of chemotherapy), 35% of patients for whom information on the second everolimus course was available did not receive the drug (Figure 2). Reasons were given for about two-thirds of patients (39/61): 11 patients had not completed the previous course; 11 patients chose to discontinue the therapy (often because of toxicity in the previous course); in three cases the data monitoring committee had recommended closure of the study with cessation of everolimus treatment; in five cases patients did not reach the starting point for everolimus therapy on protocol; in two cases the clinician decided, and in four other cases, everolimus was not given due to a variety of toxicities.
Toxicity
The recorded toxicities are shown in Figure 3. There were more hematologic toxicities in the everolimus arm and these were most obvious after the first everolimus course, with a median time to platelet count recovery to >100x109/L being 9 days longer (39 versus 29 days; P=0.006); this was reflected by a significantly greater requirement for platelet support (Table 3). The kinetics of neutrophil recovery was unaffected by everolimus, but there was significantly more use of antibiotics and a longer stay in hospital with the first course of everolimus, as well as increased oral toxicity (course 1) and higher ala- nine transaminase levels (course 2).
Cumulative risk of relapse and death in remission
The overall outcomes are shown in Table 2. The cumu- lative incidence of relapse at 5 years (Figure 4A) did not differ significantly between arms [60% versus 54%, HR 1.12 (0.82-1.52), P=0.5]. There was a significant excess of deaths in remission in the everolimus arm in the first 6
1656
haematologica | 2018; 103(10)
