
Page 131 - 2018_09-Mondo
P. 131
Time-dependent effects on competing-risk endpoints
months. The effect was significantly reduced for transplant- related mortality in the first time period and increased for death from other causes in the second time period (HR for transplant-related mortality in first 4 months: 0.78, P<0.001 and after 4 months: 1.10, P=0.090; HR for death from other causes within the first 4 months: 0.89, P=0.130 and after 4 months: 1.11, P=0.024) (Tables 3, 4 and 7).
Covariate: Karnofsky performance score
KPS exhibited a significant effect on all outcome events. While applying the proportional hazard test it was found that a covariate-specific cutpoint had to be defined for each of the competing risks examined in this study. For
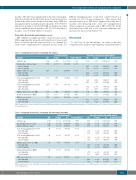
Table 5. Competing risk model 2. Competing risk relapse.
Cox model analysis
KPS the changing points of risk level could be fixed at 4 months for all outcome parameters. This means that patients with a poor KPS had a higher risk in the first 4 months after hematopoietic stem cell transplantation when compared to patients with a KPS of 80-100. In the first time period the risk for all outcome endpoints was increased at least 2-fold (Tables 3-7).
Discussion
To the best of our knowledge, our study is the first comprehensive analysis exploring time-dependent effects
Piecewise constant Cox model analysis
Variable
Patients’ age
Intermediate disease stage first 10 months
after 10 months
Advanced disease stage first 8 months
after 8 months
Year of transplantation 2001-2005 first 8 months
after 8 months
Year of transplantation 2006-2013 first 8 months
after 8 months
PBSC as graft source (vs. BM)
Reduced intensity (vs. MAC)
KPS <80 (vs. 80-100) first 4 months after 4 months
HR
1.002
1.74 2.47
1.03 0.86
1.04 1.13 1.72
P-value CI 0.074 1.000-1.005
<0.001 1.60-1.89 <0.001 2.28-2.68
0.577 0.93-1.14 0.030 0.80-0.99
0.423 0.94-1.15 <0.001 1.05-1.21 <0.001 1.53-1.94
Pvalue PH-test 0.031
<0.001 <0.001
0.002 <0.001
0.138
0.418
<0.001
HR P-value CI 1.003 0.059 0.999-1.005
1.87 <0.001 1.69-2.07 1.52 <0.001 1.36-1.77
2.92 <0.001 2.65-3.21
1.73 <0.001 1.50-1.99
0.95 0.391 0.84-1.07 1.21 0.025 1.02-1.42
0.82 <0.001 0.72-0.92 1.10 0.273 0.93-1.30
1.04 0.486 0.94-1.15 1.13 <0.001 1.05-1.22
2.10 <0.001 1.81-2.43
1.26 0.021 1.03-1.53
P-value PH-test 0.015
0.226 0.907
0.418
0.323
0.616 0.181
0.757 0.122
0.165 0.472
0.697
0.422
PBSC: peripheral blood stem cells; BM: bone marrow; MAC: myeloablative conditioning; KPS: Karnofsky performance portional hazard test.
score; HR: hazard ratio; CI confidence interval; PH-test: pro-
Piecewise constant Cox model analysis
Table 6. Competing risk model 2. Competing risk non-relapse mortality. Cox model analysis
Variable
Patients’ age
Intermediate disease stage
Advanced disease stage
Year of transplantation 2001-2005 first 8 months
after 8 months
Year of transplantation 2006-2013 first 8 months
after 8 months
PBSC as graft source (vs. BM) first 8 months
after 8 months
Reduced intensity (vs. MAC) first 4 months
after 4 months
KPS <80 (vs. 80-100) first 4 months after 4 months
HR P-value 1.019 <0.001
1.42 <0.001
1.77 <0.001 0.77 <0.001
0.65 <0.001
0.89 0.015
0.87 <0.001
1.89 <0.001
CI
1.016-1.022
1.31-1.54
1.64-1.91 0.69-0.85
0.59-0.71
0.81-0.98
0.81-0.94
1.70-2.10
P-value PH-test HR 0.473 1.019
0.269 1.42
0.053 1.75 <0.001
P-value CI <0.001 1.016-1.022
<0.001 1.30-1.54
<0.001 1.62-1.90
<0.001 0.59-0.75 0.654 0.87-1.25
<0.001 0.50-0.62 0.907 0.82-1.19
<0.001 0.68-0.84
<0.001 1.14-1.66
<0.001 0.69-0.83 0.299 0.95-1.18
<0.001 2.02-2.59
0.028 1.03-1.55
P-value PH-test 0.681
0.197
0.064
0.863 0.324
0.834 0.946
0.928
0.012
0.813 0.396
0.437
0.900
<0.001
<0.001
<0.001
<0.001
0.67 1.04
0.56 0.99
0.75
1.38
0.76 1.06
2.29
1.26
PBSC: peripheral blood stem cells; BM: bone marrow; MAC: myeloablative conditioning; KPS: Karnofsky performance portional hazard test.
score; HR: hazard ratio; CI confidence interval; PH-test: pro-
haematologica | 2018; 103(9)
1531
