
Page 130 - 2018_09-Mondo
P. 130
D. Fuerst et al.
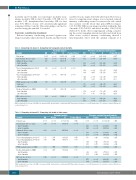
mortality and 8 months for non-relapse mortality (non- relapse mortality: HR for first 8 months: 0.75, HR for >8 months: 1.38; transplant-related mortality: HR for first year: 0.70, HR for >1 year: 1.47; all statistically significant estimates) (Tables 3 and 6). This relationship could not be revealed using the standard Cox model.
Covariate: conditioning treatment
Reduced intensity conditioning protected against non- relapse mortality only in the first 4 months and this benefi-
cial effect was no longer detectable afterwards. However, as far as its competing event, relapse, was concerned, reduced intensity conditioning seemed to increase the risk, which was constant over the whole time period (HR for relapse: 1.13, P<0.001; HR for non-relapse mortality within the first 4 months: 0.76, P<0.001, and after 4 months: 1.06, P=0.30) (Tables 5-7). In the other competing-risk setting, consider- ing the events transplant-related mortality and death from other causes, reduced intensity conditioning showed a time-dependent effect with the optimal cutpoint at 4
Table 3. Competing risk model 1. Competing risk transplant-related mortality. Cox model analysis
Piecewise constant Cox model analysis
Variable
Patient age
Intermediate disease stage Advanced disease stage
first 5 months
after 5 months
Year of transplantation 2001-2005 first 8 months
after 8 months
Year of transplantation 2006-2013 first 8 months
after 8 months
PBSC as graft source (vs. BM) first year
after 1st year
Reduced intensity (vs. MAC) first 4 months
after 4 months
KPS <80 (vs. 80-100) first 4 months after 4 months
HR
1.015
1.32 1.60
0.66 0.50
0.79
0.91
1.84
P-value CI <0.001 1.012-1.018
<0.001 1.20-1.43 <0.001 1.47-1.73
<0.001 0.60-0.73 <0.001 0.46-0.56
<0.001 0.72-0.87
0.018 0.85-0.98
<0.001 1.64-2.06
P-value PH-test 0.398
0.223 0.003
<0.001 <0.001
<0.001
<0.001
<0.001
HR P-value CI 1.015 <0.001 1.013-1.018
1.32 <0.001 1.21-1.44 1.69 <0.001 1.53-1.86
1.42 <0.001 1.26-1.61
0.58 <0.001 0.51-0.65 0.94 0.487 0.78-1.13
0.44 <0.001 0.39-0.49 0.78 0.013 0.65-0.95
0.70 <0.001 0.64-0.78
1.47 0.002 1.16-1.86
0.78 <0.001 0.70-0.87 1.10 0.090 0.99-1.22
2.10 <0.001 1.84-2.40
1.37 0.004 1.10-1.70
P-value PH-test 0.127
0.428 0.334
0.962
0.792 0.973
0.669 0.500
0.231
0.269
0.852 0.299
0.428
0.587
PBSC: peripheral blood stem cells; BM: bone marrow; MAC: myeloablative conditioning; KPS: Karnofsky performance score; HR: hazard ratio; CI confidence interval; PH-test: pro- portional hazard test.
Table 4. Competing risk model 1. Competing risk death of other cause. Cox model analysis
Piecewise constant Cox model analysis
Variable
Patients’ age
Intermediate disease stage first 10 months
after 10 months
Advanced disease stage first 10 months
after 10 months
Year of transplantation 2001-2005 Year of transplantation 2006-2013
first 8 months after 8 months
PBSC as graft source (vs. BM) Reduced intensity (vs. MAC)
first 4 months after 4 months
KPS <80 (vs. 80-100) first 4 months after 4 months
HR P-value 1.009 <0.001
1.86 <0.001 2.68 <0.001
1.10 0.078 0.98 0.714
1.01 0.784 1.04 0.317
1.88 <0.001
CI
1.006-1.012
1.71-2.04 2.47-2.92
0.99-1.23 0.88-1.09
0.91-1.13 0.96-1.12
1.67-2.12
P-value PH-test 0.752
<0.001 <0.001
0.158 0.003
0.613 0.005
<0.001
HR P-value 1.009 <0.001
2.35 <0.001 1.45 <0.001
3.39 <0.001
2.07 <0.001 1.10 0.082
0.88 0.041 1.13 0.073
1.01 0.836
0.89 0.130 1.11 0.024
2.75 <0.001
1.34 <0.001
CI
1.006-1.012
2.08-2.66 1.27-1.66
3.02-3.81
1.83-2.34 0.99-1.22
0.77-0.99 0.99-1.29
0.91-1.12
0.77-1.03 1.02-1.21
2.23-3.25
1.13-1.59
P-value PH-test 0.459
0.936 0.261
0.881
0.541 0.259
0.811 0.034
0.256
0.971 0.168
0.856
0.396
PBSC: peripheral blood stem cells; BM: bone marrow; MAC: myeloablative conditioning; KPS: Karnofsky performance score; HR: hazard ratio; CI confidence interval; PH-test: pro- portional hazard test.
1530
haematologica | 2018; 103(9)
