
Page 159 - Haematologica August 2018
P. 159
Unconventional CD56dim/CD16neg NK cells in HSCT
stages of differentiation rather than NK cell precursors (Figure 3A,B). In line with their previously reported high cytotoxicity,18 we also observed that uCD56dim NK cells express high levels of Perforin and Granzyme-B. Interestingly, we also found that uCD56dim NK cells have low levels of NKp46, thus making this NCR an additional phenotypic marker capable of distinguishing the latter sub- set from both cCD56bright and cCD56dim NK cells (Figure 3C).
uCD56dim NK cells expanded early after hHSCT have a unique transcriptional profile
To gain more insights into the biological and functional relevance of uCD56dim NK cells, we assessed the gene expression profiles of FACS-sorted circulating NK cell sub- sets from three healthy donors (three replicates for each of the three cCD56bright, cCD56dim and uCD56dim NK cell sub- sets) and from their three hHSCT recipients (three repli- cates for each of the two cCD56bright and uCD56dim NK cell subsets) three weeks after the transplant. In order to reduce data dimensionality in three main directions, we
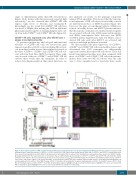
first analyzed our results via the principal component analysis (PCA) algorithm. PCA showed that the transcrip- tional signatures of NK cell subsets from healthy controls are different from those of hHSCT patients (Figure 4A). Moreover, the gene set enrichment analysis (GSEA) per- formed on healthy donors and hHSCT patients indicates that the majority of the gene sets enriched in the recipients are associated with cell cycle, DNA repair and ribonucleic acid (RNA) transcription (false discovery rate [FDR] <0.00001) (Online Supplementary Table S3). Hence, donor- derived NK cells early after hHSCT are activated and endowed with high proliferative potential.
We then analyzed the gene expression of cCD56bright, uCD56dim and cCD56dim NK cells from healthy donors, and determined that 3072 transcripts are differentially expressed between these three NK cell subsets. These dif- ferent transcriptional profiles were then compared with those of uCD56dim and cCD56bright NK cells from patients. Indeed, these latter two NK cell subsets were the only ones to have expanded and be detectable three weeks
C
AB
Figure 4. Transcriptional profiles of NK cell subsets from healthy donors and patients three weeks after haploidentical HSCT. (A) Principal component analysis (PCA) showing the gene expression profiles of cCD56bright, cCD56dim and uCD56dim NK subsets from healthy donors (HDs) and of cCD56bright and uCD56dim from patients after three weeks from haploidentical HSCT (hHSCT). (B) Hierarchical clustering of NK cell subsets from healthy donors and patients three weeks after hHSCT. Sample grouping, obtained from the expression levels of 3072 genes that are differentially expressed between cCD56bright, uCD56dim and cCD56dim NK cells from HDs. Yellow and violet colors indicate decreased and increased expression, respectively. (C) Log2 expression fold-change (FC) in uCD56dim from hHSCT patients versus cCD56bright cells (x-axis), and versus cCD56dim cells (y-axis) from HDs. C1 and C2 boxes indicate the genes similarly expressed with cCD56dim from HDs but downregulated (C1) and upregulated (C2) in uCD56dim from hHSCT versus cCD56bright from HDs. C3 box indicates the genes downregulated in uCD56dim from hHSCT versus cCD56dim from HDs and similarly expressed with cCD56bright from HDs. Downmodulated genes highlighted in green and upmodulated genes highlighted in red are associated with NK cell maturation, genes highlighted in violet are associated with NK cell activation or cytotoxicity.
haematologica | 2018; 103(8)
1395
