
Page 81 - Haematologica Vol. 109 - July 2024
P. 81
ARTICLE - Targeting TNF/IL-17/MAPK in hE2A-PBX1 zebrafish H. Luo et al.
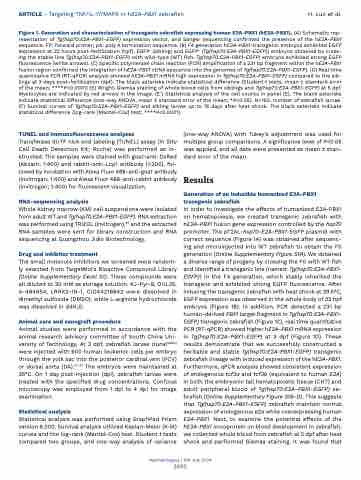
Figure 1. Generation and characterization of transgenic zebrafish expressing human E2A-PBX1 (hE2A-PBX1). (A) Schematic rep- resentation of Tg(hsp70:E2A-PBX1-EGFP) expression vector, and Sanger sequencing confirmed the presence of the hE2A-PBX1 sequence. FP: forward primer; pA: poly A termination sequence. (B) F4 generation hE2A-PBX1-transgenic embryos exhibited EGFP expression at 32 hours post-fertilization (hpf). EGFP- (sibling) and EGFP+ (Tg(hsp70:E2A-PBX1-EGFP)) embryos obtained by cross- ing the stable line Tg(hsp70:E2A-PBX1-EGFP) with wild-type (WT) fish. Tg(hsp70:E2A-PBX1-EGFP) embryos exhibited strong EGFP fluorescence (white arrows). (C) Specific polymerase chain reaction (PCR) amplification of a 231 bp fragment within the hE2A-PBX1 fusion region confirmed the integration of hE2A-PBX1 cDNA sequence into the genomes of Tg(hsp70:E2A-PBX1-EGFP). (D) Real time quantitative PCR (RT-qPCR) analysis showed hE2A-PBX1 mRNA high expression in Tg(hsp70:E2A-PBX1-EGFP) compared to the sib- lings at 3 days post-fertilization (dpf). The black asterisks indicate statistical difference (Student t tests, mean ± standard error of the mean; ****P<0.0001) (E) Wright-Giemsa staining of whole blood cells from siblings and Tg(hsp70:E2A-PBX1-EGFP) at 5 dpf. Myelocytes are indicated by red arrows in the image. (E’) Statistical analysis of the cell counts in panel (E). The black asterisks indicate statistical difference (one-way ANOVA, mean ± standard error of the mean; *P<0.05). N>150, number of zebrafish larvae. (F) Survival curves of Tg(hsp70:E2A-PBX1-EGFP) and sibling larvae up to 15 days after heat shock. The black asterisks indicate statistical difference (log-rank [Mantel-Cox] test; ****P<0.0001).
TUNEL and immunofluorescence analyses
Transferase dUTP nick end labeling (TUNEL) assay (In Situ Cell Death Detection Kit; Roche) was performed as in- structed. The samples were stained with goat-anti-DsRed (Abcam; 1:400) and rabbit-anti-Lcp1 antibody (1:200), fol- lowed by incubation with Alexa Fluor 488-anti-goat antibody (Invitrogen; 1:400) and Alexa Fluor 488-anti-rabbit antibody (Invitrogen; 1:400) for fluorescent visualization.
RNA-sequencing analysis
Whole kidney marrow (KM) cell suspensions were isolated from adult WT and Tg(hsp70:E2A-PBX1-EGFP). RNA extraction was performed using TRIZOL (Invitrogen),30 and the extracted RNA samples were sent for library construction and RNA sequencing at Guangzhou Jidio Biotechnology.
Drug and inhibitor treatment
The small molecule inhibitors we screened were random- ly selected from TargetMol’s Bioactive Compound Library (Online Supplementary Excel S1). These compounds were all diluted to 20 mM as storage solution. KJ-Pyr-9, OUL35, A-484954, LRRK2-IN-1, CID44216842 were dissolved in dimethyl sulfoxide (DMSO), while L-arginine hydrochloride was dissolved in ddH2O.
Animal care and xenograft procedure
Animal studies were performed in accordance with the animal research advisory committee of South China Uni- versity of Technology. At 3 dpf, zebrafish larvae (runx1w84x) were injected with 600 human leukemic cells per embryo through the yolk sac into the posterior cardinal vein (PCV) or dorsal aorta (DA).31-33 The embryos were maintained at 35°C. On 1 day post-injection (dpi), zebrafish larvae were treated with the specified drug concentrations. Confocal microscopy was employed from 1 dpi to 4 dpi for image examination.
Statistical analysis
Statistical analysis was performed using GraphPad Prism version 6.000. Survival analysis utilized Kaplan-Meier (K-M) curves and the log-rank (Mantel-Cox) test. Student t tests compared two groups, and one-way analysis of variance
(one-way ANOVA) with Tukey’s adjustment was used for multiple group comparisons. A significance level of P<0.05 was applied, and all data were presented as mean ± stan- dard error of the mean.
Results
Generation of an inducible humanized E2A-PBX1 transgenic zebrafish
In order to investigate the effects of humanized E2A-PBX1 on hematopoiesis, we created transgenic zebrafish with hE2A-PBX1 fusion gene expression controlled by the hsp70 promoter. The pT2AL-hsp70-E2A-PBX1-EGFP plasmid with correct sequence (Figure 1A) was obtained after sequenc- ing and microinjected into WT zebrafish to obtain the F0 generation (Online Supplementary Figure S1A). We obtained a diverse range of progeny by crossing the F0 with WT fish and identified a transgenic line (named: Tg(hsp70:E2A-PBX1- EGFP)) in the F4 generation, which stably inherited the transgene and exhibited strong EGFP fluorescence. After inducing the transgenic zebrafish with heat shock at 39.5°C, EGFP expression was observed in the whole body of 32 hpf embryos (Figure 1B). In addition, PCR detected a 231 bp human-derived PBX1 target fragment in Tg(hsp70:E2A-PBX1- EGFP) transgenic zebrafish (Figure 1C), real time quantitative PCR (RT-qPCR) showed higher hE2A-PBX1 mRNA expression in Tg(hsp70:E2A-PBX1-EGFP) at 3 dpf (Figure 1D). These results demonstrate that we successfully constructed a heritable and stable Tg(hsp70:E2A-PBX1-EGFP) transgenic zebrafish lineage with induced expression of the hE2A-PBX1. Furthermore, qPCR analysis showed consistent expression of endogenous tcf3a and tcf3b (equivalent to human E2A) in both the embryonic tail hematopoietic tissue (CHT) and adult peripheral blood of Tg(hsp70:E2A-PBX1-EGFP) ze- brafish (Online Supplementary Figure S1B-D). This suggests that Tg(hsp70:E2A-PBX1-EGFP) zebrafish maintain normal expression of endogenous e2a while overexpressing human E2A-PBX1. Next, to examine the potential effects of the hE2A-PBX1 oncoprotein on blood development in zebrafish, we collected whole blood from zebrafish at 5 dpf after heat shock and performed Giemsa staining. It was found that
Haematologica | 109 July 2024
2095
