
Page 303 - Haematologica Vol. 109 - July 2024
P. 303
LETTER TO THE EDITOR
Haematologica | 109 July 2024
2317
C
AB
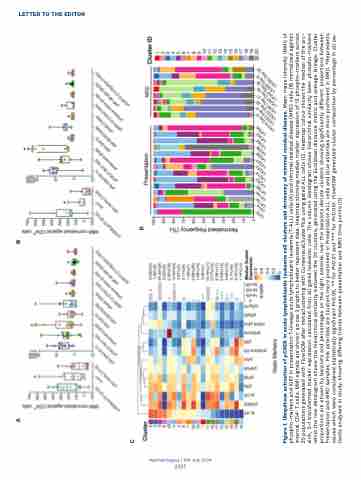
Figure 1. Ubiquitous activation of pCREB in acute lymphoblastic leukemia cell clusters and dormancy of minimal residual disease. Mean mass intensity (MMI) of phospho-markers and Ki67 in presentation T-lineage acute lymphoblastic leukemia (T-ALL) cells (A) and minimal residual disease (MRD) cells (B) normalized against internal CD4+ T cells. MMI signals are shown across 2 graphs to better represent data. Heatmap showing median marker expression of 13 phospho-markers across 20 populations generated with FlowSOM after metaclustering with ConsensusClusterPlus using gated ALL cells (C). Heatmap colour shows the median of the arc- sinh, 0-1 transformed marker expression calculated from all gated leukemic cells. The column dendogram shows hierarchical similarity been phospho-markers while the row dendogram shows the hierarchical similarity between the 20 clusters, generated using the Euclidean distance metric and average linkage. Cluster proportions are shown by barplots and percentages on the right. Asterisk over the barplots denote clusters showing significantly different proportions between Presentation and MRD samples. Pink asterisks are clusters more prominent in Presentation ALL cells and blue asterisks are more prominent in MRD. *Represents values which were considered statistically significant P<0.05, ** for P<0.01 and *** for P<0.001. FlowSOM generated cluster composition by percentage in all pa- tients analysed in study, showing differing trends between presentation and MRD time points (D).
D
