
Page 258 - Haematologica Vol. 109 - July 2024
P. 258
LETTER TO THE EDITOR
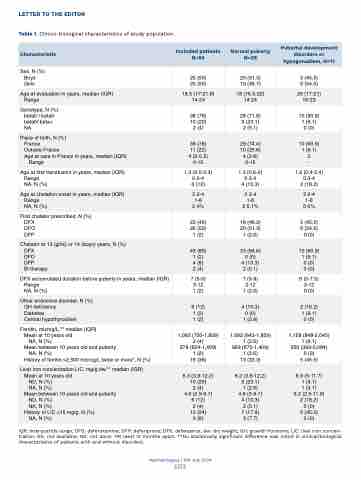
Table 1. Clinico-biological characteristics of study population.
Characteristic
Included patients N=50
Normal puberty N=39
Pubertal development disorders or hypogonadism, N=11
Sex, N (%) Boys
Girls
25 (50) 25 (50)
20 (51.3) 19 (48.7)
5 (45.5) 6 (54.5)
Age at evaluation in years, median (IQR) Range
18.5 (17-21.8) 14-24
18 (16.5-22) 14-24
20 (17-21) 16-23
Genotype, N (%) beta0 / beta0 beta0/ beta+ NA
38 (76) 10 (20) 2 (4)
28 (71.8) 9 (23.1) 2 (5.1)
10 (90.9) 1 (9.1) 0 (0)
Place of birth, N (%)
France
Outside France
Age at care in France in years, median (IQR)
Range
39 (78)
11 (22) 4 (2-5.5) 0-15
29 (74.4) 10 (25.6) 4 (2-6) 0-15
10 (90.9) 1 (9.1)
2-
Age at first transfusion in years, median (IQR) Range
NA, N (%)
1.3 (0.5-2.3) 0.2-4
6 (12)
1.3 (0.6-2) 0.3-4
4 (10.3)
1.2 (0.4-2.4) 0.3-4
2 (18.2)
Age at chelation onset in years, median (IQR) Range
NA, N (%)
3 2-4 1-6 2 4%
3 2-4 1-6
2 5.1%
3 2-4 1-6 0 0%
First chelator prescribed, N (%) DFX
DFO DFP
23 (46) 26 (52) 1 (2)
18 (46.2) 20 (51.3) 1 (2.6)
5 (45.5) 6 (54.5) 0 (0)
Chelator at 13 (girls) or 14 (boys) years, N (%) DFX
DFO
DFP Bi-therapy
43 (86) 1 (2) 4 (8) 2 (4)
33 (84.6) 0 (0)
4 (10.3) 2 (5.1)
10 (90.9) 1 (9.1) 0 (0)
0 (0)
DFX accumulated duration before puberty in years, median (IQR) Range
NA, N (%)
7 (5-9) 3-12 1 (2)
7 (5-9) 3-12 1 (2.6)
6 (5-7.5) 3-12
0 (0)
Other endocrine disorder, N (%) GH deficiency
Diabetes
Central hypothyroidism
6 (12) 1 (2) 1 (2)
4 (10.3) 0 (0) 1 (2.6)
2 (18.2) 1 (9.1) 0 (0)
Ferritin, microg/L,** median (IQR) Mean at 10 years old
NA, N (%)
Mean between 10 years old and puberty
NA, N (%)
History of ferritin >2,500 microg/L twice or more*, N (%)
1,092 (700-1,859) 2 (4)
978 (624-1,409) 1 (2)
18 (36)
1,092 (643-1,859) 1 (2.6)
983 (670-1,409) 1 (2.6)
13 (33.3)
1,158 (848-2,045) 1 (9.1)
950 (399-2,084) 0 (0)
5 (45.5)
Liver iron concentration LIC, mg/g dw,** median (IQR) Mean at 10 years old
ND, N (%)
NA, N (%)
Mean between 10 years old and puberty
ND, N (%)
NA, N (%)
History of LIC >15 mg/g, N (%)
NA, N (%)
6.3 (3.9-12.2) 10 (20)
2 (4)
4.9 (2.9-9.7) 6 (12)
2 (4)
12 (24)
3 (6)
6.2 (3.8-12.2) 9 (23.1)
1 (2.6) 4.8 (3-9.7) 4 (10.3)
2 (5.1)
7 (17.9)
3 (7.7)
6.9 (5-11.7) 1 (9.1)
1 (9.1) 6.2 (2.5-11.9) 2 (18.2)
0 (0)
5 (45.5)
0 (0)
IQR: interquartile range; DFO: deferoxamine; DFP: deferiprone; DFX: deferasirox; dw: dry weight; GH: growth hormone; LIC: liver iron concen- tration; NA: not available; ND: not done. *At least 12 months apart. **No statistically significant difference was noted in clinical/biological characteristics of patients with and without disorders.
Haematologica | 109 July 2024
2272
