
Page 230 - Haematologica Vol. 109 - July 2024
P. 230
ARTICLE - ICARIA-MM final overall survival analysis P.G. Richardson et al. AB
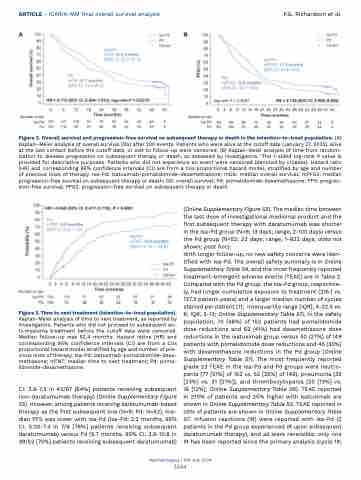
Figure 2. Overall survival and progression-free survival on subsequent therapy or death in the intention-to-treat population. (A) Kaplan–Meier analysis of overall survival (OS) after 220 events. Patients who were alive at the cutoff date (January 27, 2022), alive at the last contact before the cutoff date, or lost to follow-up were censored. (B) Kaplan-Meier analysis of time from random- ization to disease progression on subsequent therapy or death, as assessed by investigators. aThe 1-sided log-rank P value is provided for descriptive purposes. Patients who did not experience an event were censored (denoted by crosses). Hazard ratio (HR) and corresponding 95% confidence intervals (CI) are from a Cox proportional hazard model, stratified by age and number of previous lines of therapy. Isa-Pd: isatuximab-pomalidomide-dexamethasone; mOS: median overall survival; mPFS2: median progression-free survival on subsequent therapy or death; OS: overall survival; Pd: pomalidomide-dexamethasone; PFS: progres- sion-free survival; PFS2: progression-free survival on subsequent therapy or death.
Figure 3. Time to next treatment (intention-to-treat population).
Kaplan-Meier analysis of time to next treatment, as reported by investigators. Patients who did not proceed to subsequent an- ti-myeloma treatment before the cutoff date were censored. Median follow-up was 52.4 months. Hazard ratios (HR) and corresponding 95% confidence intervals (CI) are from a Cox proportional hazard model stratified by age and number of pre- vious lines of therapy. Isa-Pd: isatuximab-pomalidomide-dexa- methasone; mTNT: median time to next treatment; Pd: poma- lidomide-dexamethasone.
CI: 3.8-7.3 in 43/67 [64%] patients receiving subsequent non-daratumumab therapy) (Online Supplementary Figure S5). However, among patients receiving daratumumab-based therapy as the first subsequent line (N=9; Pd: N=52), me- dian PFS was lower with Isa-Pd (Isa-Pd: 2.2 months, 95% CI: 0.03-7.4 in 7/9 [78%] patients receiving subsequent daratumumab) versus Pd (5.7 months, 95% CI: 3.8-10.8 in 39/52 [75%] patients receiving subsequent daratumumab)
(Online Supplementary Figure S5). The median time between the last dose of investigational medicinal product and the first subsequent therapy with daratumumab was shorter in the Isa-Pd group (N=9; 13 days; range, 2-100 days) versus the Pd group (N=52; 22 days; range, 1-822 days; data not shown; post hoc).
With longer follow-up, no new safety concerns were iden- tified with Isa-Pd. The overall safety summary is in Online Supplementary Table S4, and the most frequently reported treatment-emergent adverse events (TEAE) are in Table 2. Compared with the Pd group, the Isa-Pd group, respective- ly, had longer cumulative exposure to treatment (216.1 vs. 137.3 patient-years) and a larger median number of cycles started per patient (11; interquartile range [IQR], 4-22.5 vs. 6; IQR, 3-13; Online Supplementary Table S1). In the safety population, 70 (46%) of 152 patients had pomalidomide dose reductions and 62 (41%) had dexamethasone dose reductions in the isatuximab group versus 40 (27%) of 149 patients with pomalidomide dose reductions and 45 (30%) with dexamethasone reductions in the Pd group (Online Supplementary Table S1). The most frequently reported grade ≥3 TEAE in the Isa-Pd and Pd groups were neutro- penia (77 [51%] of 152 vs. 52 [35%] of 149), pneumonia (35 [23%] vs. 31 [21%]), and thrombocytopenia (20 [13%] vs. 18 [12%]; Online Supplementary Table S6). TEAE reported in ≥10% of patients and ≥5% higher with isatuximab are shown in Online Supplementary Table S5. TEAE reported in ≥5% of patients are shown in Online Supplementary Table S7. Infusion reactions (IR) were reported with Isa-Pd (2 patients in the Pd group experienced IR upon subsequent daratumumab therapy), and all were reversible; only one IR has been reported since the primary analysis (cycle 19;
Haematologica | 109 July 2024
2244
