
Page 208 - Haematologica Vol. 109 - July 2024
P. 208
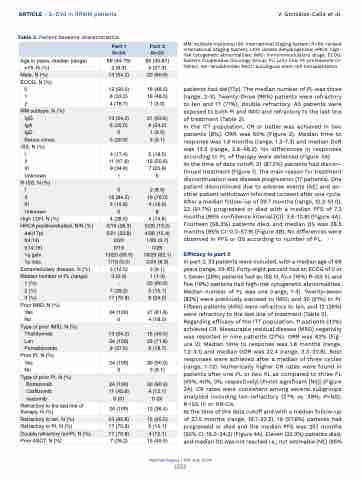
ARTICLE - S-DVd in RRMM patients Table 2. Patient baseline characteristics.
V. González-Calle et al. MM: multiple myeloma; ISS: International Staging System; R-ISS: revised
International Staging System; LDH: lactate dehydrogenase; HRCA: high- risk cytogenetic abnormalities; IMID: immunomodulatory drugs; ECOG: Eastern Cooperative Oncology Group; PL: prior line; PI: proteasome in- hibitor; len: lenalidomide; ASCT: autologous stem cell transplantation.
patients had del(17p). The median number of PL was three (range, 2-3). Twenty-three (96%) patients were refractory to len and 17 (71%), double refractory. All patients were exposed to both PI and IMID and refractory to the last line of treatment (Table 2).
In the ITT population, CR or better was achieved in two patients (8%). ORR was 50% (Figure 2). Median time to response was 1.8 months (range, 1.3-7.3) and median DoR was 13.5 (range, 2.8-48.2). No differences in responses according to PL of therapy were detected (Figure 3A).
At the time of data cutoff, 21 (87.5%) patients had discon- tinued treatment (Figure 1). The main reason for treatment discontinuation was disease progression (17 patients). One patient discontinued due to adverse events (AE) and an- other patient withdrawn informed consent after one cycle. After a median follow-up of 39.7 months (range, 12.2-51.0), 22 (91.7%) progressed or died with a median PFS of 7.2 months (95% confidence interval [CI]: 3.6-10.8) (Figure 4A). Fourteen (58.3%) patients died, and median OS was 28.5 months (95% CI: 0.0-57.9) (Figure 4B). No differences were observed in PFS or OS according to number of PL.
Efficacy in part 2
In part 2, 33 patients were included, with a median age of 69 years (range, 33-81). Forty-eight percent had an ECOG of 0 or 1. Seven (26%) patients had an ISS III, four (16%) R-ISS III, and five (19%) patients had high-risk cytogenetic abnormalities. Median number of PL was one (range, 1-3). Twenty-seven (82%) were previously exposed to IMID; and 30 (91%) to PI. Fifteen patients (45%) were refractory to len, and 12 (36%) were refractory to the last line of treatment (Table 2). Regarding efficacy of the ITT population, 11 patients (33%) achieved CR. Measurable residual disease (MRD) negativity was reported in nine patients (27%). ORR was 82% (Fig- ure 2). Median time to response was 1.8 months (range, 1.2-4.1) and median DOR was 22.4 (range, 3.3-30.8). Best responses were achieved after a median of three cycles (range, 1-13). Numerically higher CR rates were found in patients after one PL or two PL as compared to three PL (45%, 40%, 0%, respectively) (P=not significant [NS]) (Figure 3A). CR rates were consistent among several subgroups analyzed including len-refractory (27% vs. 39%; P=NS), R-ISS III or HR-CA.
At the time of the data cutoff and with a median follow-up of 27.0 months (range, 19.7-32.5), 19 (57.6%) patients had progressed or died and the median PFS was 25.1 months (95% CI: 16.0-34.2) (Figure 4A). Eleven (33.3%) patients died, and median OS was not reached i.e., not estimable (NE) (95%
      Age in years, median (range) >75, N (%)
Male, N (%) ECOG, N (%)
0 1 2
MM subtype, N (%) IgG
IgA
IgD Bence-Jones
ISS, N (%) I
II
III Unknown
R-ISS, N (%) I
II
III Unknown
High LDH, N (%)
HRCA positive/studied, N/N (%)
del(17p) t(4;14) t(14;16) 1q gain 1p loss
Extramedullary disease, N (%) Median number of PL (range)
1 (%) 2 (%) 3 (%)
Prior IMID, N (%) Yes
No
Type of prior IMID, N (%)
Thalidomide Len Pomalidomide
Prior PI, N (%) Yes
No
Type of prior PI, N (%)
Bortezomib Carfilzomib Ixazomib
Refractory to the last line of therapy, N (%)
Refractory to len, N (%) Refractory to PI, N (%)
Double refractory len/PI, N (%) Prior ASCT, N (%)
Part 1 N=24
66 (44-76) 2 (8.3) 13 (54.2)
12 (50.0) 8 (33.3) 4 (16.7)
13 (54.2) 6 (25.0) 0
5 (20.8)
4 (17.4) 11 (47.8) 8 (34.8) 1
0
16 (84.2) 3 (15.8)
5
4 (28.6) 5/19 (26.3) 5/21 (23.8) 0/20 0/19 13/20 (65.0) 1/19 (5.0) 3 (12.5)
3 (2-3)
-
7 (29.2) 17 (70.8)
24 (100) 0
13 (54.2) 24 (100) 9 (37.5)
24 (100) 0
24 (100) 11 (45.8) 0 (0)
24 (100)
23 (95.8) 17 (70.8) 17 (70.8) 7 (29.2)
Part 2 N=33
69 (33-81) 9 (27.3) 20 (60.6)
16 (48.5) 16 (48.5) 1 (3.0)
21 (63.6) 8 (24.2) 1 (3.0) 3 (9.1)
5 (18.5) 15 (55.6) 7 (25.9) 6
2 (8.0) 19 (76.0) 4 (16.0)
8
4 (14.8) 5/26 (19.2) 4/26 (15.4) 1/26 (3.7) 0/26 18/29 (62.1) 2/24 (8.3) 3 (9.1)
1 (1-3) 20 (60.6) 5 (15.1)
8 (24.2)
27 (81.8) 4 (18.2)
15 (45.5) 23 (71.8) 6 (18.7)
30 (90.9) 3 (9.1)
30 (90.9) 4 (12.1) 0 (0)
12 (36.4)
15 (45.5) 5 (15.1) 4 (12.1) 15 (45.5)
                     Haematologica | 109 July 2024
2222
