
Page 197 - Haematologica Vol. 109 - July 2024
P. 197
ARTICLE - FLT3L promotes osteolysis in multiple myeloma
D. Shin et al.
ering the infrequent occurrence of osteolytic bone lesions in ALL and AML, these findings indicate a potential association between FLT3L and bone osteolysis in MM.
FLT3L levels in BM aspirates and plasma were also reported to increase through MM progression and reach the maximal in patients with relapsed/refractory MM.19 However, we were not able to determine a statistically meaningful increase in FLT3L in relapse/refractory MM or in disease status in our cohort (Online Supplementary Figure S1A-C). The observed heterogeneity in FLT3L levels could be due to a possible discrepancy in the sample collection (collection time and sample status). As an alternative measure to reflect tumor burden and aggressiveness of tumor microenvironment, we thus determined the percentage of plasma cells among total
nucleated cells and then examined the association of the plasma cell percentage with FLT3L levels (N=43). The percent- age of plasma cells showed a significant (P=0.032) positive correlation with the FLT3L level (Figure 1B), supporting the view that the FLT3L level increases through MM progression in Korean patients. To further investigate the association of the FLT3L level with bone osteolysis, we next grouped the 43 MM patients for whom the FLT3L levels were measured into 27 patients with osteolytic bone lesion and 16 patients without the lesion. The FLT3L level was significantly (P<0.01) elevated in patients with osteolytic bone lesion (median 194.70, IQR, 152.52-242.27) compared with those in patients without the bone lesion (median 141.62 pg/mL, IQR, 109.57- 215.98) (Figure 1C). Moreover, we performed a multivariate
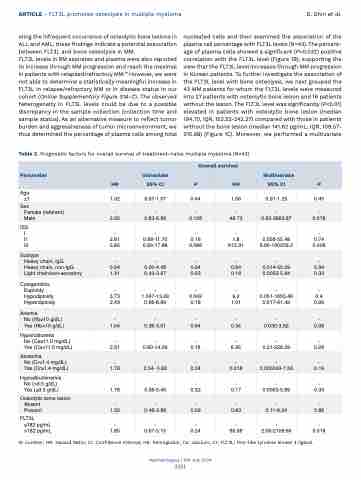
Table 2. Prognostic factors for overall survival of treatment-naïve multiple myeloma (N=43)
Parameter
Overall survival
Univariate
Multivariate
HR
95% CI
P
HR
95% CI
P
Age ±1
1.02
0.97-1.07
0.44
1.06
0.91-1.23
0.45
Sex
Female (referent) Male
- 2.35
- 0.83-6.68
- 0.108
- 48.73
- 0.65-3663.87
- 0.078
ISS
II III
- 2.81 3.85
- 0.68-11.70 0.83-17.88
- 0.16 0.086
- 1.8 813.31
- 0.058-55.48 6.60-100259.2
- 0.74 0.006
Subtype
Heavy chain, IgG
Heavy chain, non-IgG Light chain/non-secretory
- 0.94 1.31
- 0.20-4.48 0.43-3.97
- 0.94 0.63
- 0.84 0.18
- 0.014-50.29 0.0053-5.84
- 0.94 0.33
Cytogenetics Euploidy Hypodiploidy Hyperdiploidy
- 3.73 2.43
- 1.047-13.29 0.66-8.89
- 0.042 0.18
- 9.2 1.01
- 0.051-1655.46 0.017-61.42
- 0.4 0.99
Anemia
No (Hb≥10 g/dL) Yes (Hb<10 g/dL)
- 1.04
- 0.36-3.01
- 0.94
- 0.34
- 0.030-3.82
- 0.38
Hypercalcemia
No (Ca≥11.0 mg/dL) Yes (Ca<11.0 mg/dL)
- 2.91
- 0.60-14.09
- 0.18
- 6.95
- 0.21-228.29
- 0.28
Azotemia
No (Cr<1.4 mg/dL) Yes (Cr≥1.4 mg/dL)
- 1.78
- 0.54- 5.88
- 0.34
- 0.018
- 0.000043-7.56
- 0.19
Hypoalbuminemia No (>3.5 g/dL) Yes (≤3.5 g/dL)
- 1.78
- 0.58-5.45
- 0.32
- 0.17
- 0.0053-5.69
- 0.33
Osteolytic bone lesion Absent
Present
- 1.32
- 0.48-3.68
- 0.59
- 0.83
- 0.11-6.34
- 0.86
FLT3L
≤182 pg/mL >182 pg/mL
- 1.85
- 0.67-5.15
- 0.24
- 65.96
- 2.06-2109.60
- 0.018
N: number; HR: Hazard Ratio; CI: Confidence Interval; Hb: hemoglobin; Ca: calcium; Cr: FLT3L: fms-like tyrosine kinase 3 ligand.
Haematologica | 109 July 2024
2211
