
Page 195 - Haematologica Vol. 109 - July 2024
P. 195
ARTICLE - FLT3L promotes osteolysis in multiple myeloma
Analyses for clinical factors
Clinical variables of patients with MM included age, sex, disease status, serum M-protein, and osteolytic lesion; these were reviewed in the electronic medical records and included in the description of patients’ characteristics. MM-related variables of stage, subtype, the presence of anemia, hypercalcemia, azotemia, and osteolytic bone le- sion were converted into categorical variables and used for survival analysis in view of prognostic factors.
RNA isolation and quantitative real-time polymerase chain reaction
Total RNA of the cells was extracted using RNeasy Mini Kit and QIAshredder (GIAGEN; Valencia, CA, USA) and synthe- sized into cDNA through the SuperScript III First-Strand Synthesis System (Invitrogen; Carlsbad, CA, USA). mRNA level was determined by 2XqPCRBIO SyGreen Blue Mix Lo- ROX (PCR Biosystems; Wayne, PA, USA) and normalized by that of an internal control GAPDH. All reactions were car- ried out in LightCycler® 96 (Roche; Indianapolis, IN, USA). Primer sequences used were as follows: hFLT3L sense: 5’-ACCTATCTCCTCCTGCTGCT-3’, antisense: 5’-GGTAGT- CAGACAGCTCACGG-3’; hDKK1 sense: 5’-GTCCAAGATCTG- TAAACCTGTCCT-3’, antisense: 5’-AGCCTAGAAGAATTACTG- GCTTGA-3’, hGAPDH sense: 5’-GCAAATTCCATGGCACCGTC-3’, antisense: 5’-TCGCCCCACTTGATTTTGGA-3’; mDkk1 sense: 5’-TCCGTCTGCCTCCGATCATC-3’, antisense: 5’-GCCTTTC- CGTTTGTGCTTGG-3’; mGapdh sense: 5’- CATGTTCCAGTAT- GACTCCACTC-3’, antisense: 5’-GGCCTCACCCCATTTGATGT-3’. SpectraMax i3x (NFEC-2017-12-241146) was used for quanti- tative real-time polymerase chain reaction (RT-qPCR) anal- ysis at the Core Facility Center for Chronic and Metabolic Diseases at Sookmyung Women’s University.
Statistical analysis
Statistical analyses for clinical parameters were performed using Stata version 13 (Stata Corp.; College Station, TX, USA) and GraphPad Prism v 5.00 (GraphPad Software Inc.; San Diego, CA, USA). Data were presented as mean ± standard deviation (SD). Statistical significance (P-values) was de- termined by one-way ANOVA followed by Dunnett’s post hoc correction or two-way ANOVA with Tukey’s post hoc correction. The Mann-Whitney test was used to compare the level of FLT3L between two groups. Interquartile range (IQR) was calculated to estimate the distribution of FLT3L level in each group. Linear regression analysis was used to investigate the association between FLT3L level and my- eloma tumor cell burden in BM. Overall survival (OS) was defined as the interval between the initial diagnosis of MM and death due to any cause or the last clinical follow-up. Survival probabilities were estimated using the Kaplan-Meier method and analyzed using Cox proportional hazard model.
Analysis of transcriptomic data
We obtained mRNA expression data (GSE2658) from the Gene
D. Shin et al. Expression Omnibus (GEO) database together with patient
subtype (PAM cluster) and clinical information. As instructed in the original study,22 we used the data from 414 samples in the dataset after removing the samples contaminated with myeloid or normal plasma cells. The probe intensities were first converted into log2-intensities and then normalized using quantile normalization.23 To identify expressed genes, we fitted a Gaussian mixture model to the distribution of the normalized log2-intensities and selected the genes whose intensities were higher in half of the samples than the threshold intensity at which the 2 fitted Gaussian prob- ability density functions meet. Next, we identified molecular signatures that define individual subtypes of patients with MM using the previously reported statistical method.24 In brief, for the selected expressed genes, we calculated their log2-fold-changes with respect to their median values, and the log2-fold-changes were then normalized using quantile normalization. For each gene, we calculated an observed t statistic value in the comparison of one subtype versus the others. We then estimated an empirical null distribution of the t statistic value by performing random permutations of the samples 1,000 times, calculating t statistic values for
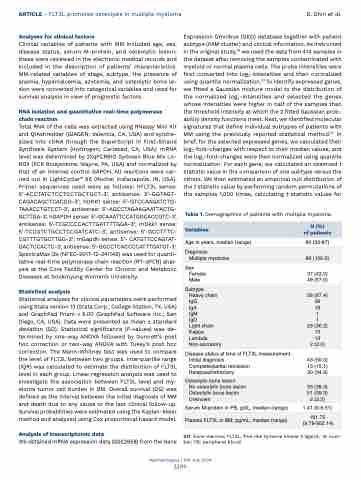
Table 1. Demographics of patients with multiple myeloma.
Variables
N (%)
of patients
Age in years, median (range)
63 (33-87)
Diagnosis
Multiple myeloma
86 (100.0)
Sex Female Male
37 (43.0) 49 (57.0)
Subtype
Heavy chain IgG
IgA
IgM
IgD
Light chain Kappa Lambda Non-secretory
58 (67.4) 36
19
1
26 (30.2) 13
13
2 (2.3)
Disease status at time of FLT3L measurement Initial diagnosis
Complete/partial remission Relapsed/refractory
43 (50.0) 13 (15.1) 30 (34.9)
Osteolytic bone lesion
No osteolytic bone lesion Osteolytic bone lesion Unknown
33 (38.3) 51 (59.3) 2 (2.3)
Serum M-protein in PB, g/dL, median (range)
1.41 (0-9.51)
Plasma FLT3L in BM, pg/mL, median (range)
161.75 (9.79-952.14)
Haematologica | 109 July 2024
2209
BM: bone marrow; FLT3L: fms-like tyrosine kinase 3 ligand; N: num- ber; PB: peripheral blood.
