
Page 132 - Haematologica Vol. 109 - July 2024
P. 132
ARTICLE - Ppm1b regulates HSC homeostasis
Z. Lu et al.
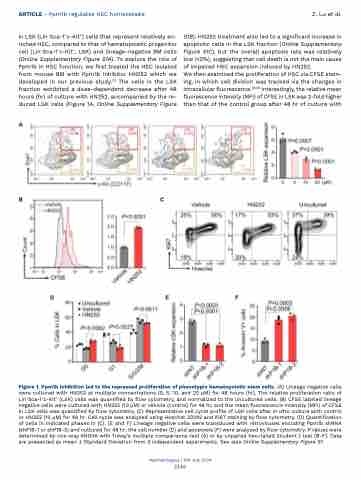
in LSK (Lin−Sca-1+c-Kit+) cells that represent relatively en- riched HSC, compared to that of hematopoietic progenitor cell (Lin−Sca-1-c-Kit+, LSK) and lineage-negative BM cells (Online Supplementary Figure S1A). To explore the role of Ppm1b in HSC function, we first treated the HSC isolated from mouse BM with Ppm1b inhibitor HN252 which we developed in our previous study.23 The cells in the LSK fraction exhibited a dose-dependent decrease after 48 hours (hr) of culture with HN252, accompanied by the re- duced LSK cells (Figure 1A, Online Supplementary Figure
A
BC
S1B). HN252 treatment also led to a significant increase in apoptotic cells in the LSK fraction (Online Supplementary Figure S1C), but the overall apoptosis rate was relatively low (<5%), suggesting that cell death is not the main cause of impaired HSC expansion induced by HN252.
We then examined the proliferation of HSC via CFSE stain- ing, in which cell division was tracked via the changes in intracellular fluorescence.29,30 Interestingly, the relative mean fluorescence intensity (MFI) of CFSE in LSK was 2-fold higher than that of the control group after 48 hr of culture with
DEF
Figure 1. Ppm1b inhibition led to the repressed proliferation of phenotypic hematopoietic stem cells. (A) Lineage negative cells were cultured with HN252 at multiple concentrations (0, 5, 10, and 20 μM) for 48 hours (hr). The relative proliferation ratio of Lin−Sca-1+c-Kit+ (LSK) cells was quantified by flow cytometry, and normalized to the uncultured cells. (B) CFSE labeled lineage negative cells were cultured with HN252 (10 μM) or vehicle (control) for 48 hr, and the mean fluorescence intensity (MFI) of CFSE in LSK cells was quantified by flow cytometry. (C) Representative cell cycle profile of LSK cells after in vitro culture with control or HN252 (10 μM) for 48 hr. Cell cycle was analyzed using Hoechst 33342 and Ki67 staining by flow cytometry. (D) Quantification of cells in indicated phases in (C). (E and F) Lineage negative cells were transduced with retroviruses encoding Ppm1b shRNA (shP1B-1 or shP1B-2) and cultured for 48 hr; the cell number (E) and apoptosis (F) were analyzed by flow cytometry. P values were determined by one-way ANOVA with Tukey’s multiple comparisons test (A) or by unpaired two-tailed Student t test (B-F). Data are presented as mean ± Standard Deviation from 3 independent experiments. See also Online Supplementary Figure S1.
Haematologica | 109 July 2024
2146
