
Page 72 - Haematologica June
P. 72
M. Brusson et al.
ABC
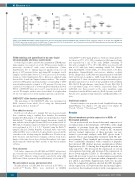
Figure 2. Lu/BCAM and CD147 erythroid expression are increased under hydroxycarbamide (HC) treatment. Flow cytometry analyses of (A and B) Lu/BCAM and (C) CD147 expression on red blood cells (RBC) from 17 untreated (UT), 16 HC-treated (HC), and 11 interferon-α-treated (IFN) polycythemia vera patients. MFI: mean fluorescence intensity. Horizontal lines represent medians.
974
ITRAQ labeling and quantification by nano-liquid chromatography and mass spectrometry
Isobaric tag for relative and absolute quantitation (ITRAQ) mul- tiplex analysis was carried out at the 3P5 proteomics facility as previously described,21 with some modifications (Online Supplementary File 1). Trypsin digested peptides from red cell ghosts of 3 PV patients (before and during HC treatment: total 6 samples) and 2 healthy donors (CT) were processed. (For further details see Online Supplementary File 1). Data were analyzed using Protein Pilot 4 with the Uniprot human database. The analysis yielded 12,459 peptide spectrum matches corresponding to 2664 non-redundant peptides assigned to 375 proteins. Proteins were considered over-expressed or down-regulated when they showed PV/CT or PVHC/PV ratios ≥1.3 or ≤0.7, respectively, in at least 2 out of 3 PV samples, with no ratios lower than 1.2 or higher than 0.8 for over-expressed or down-regulated proteins, respectively.
JAK2V617F allele burden quantification
The percentage of the JAK2V617F allele was determined in DNA extracted from whole blood using the Mutaquant® (Ipsogen) method as described.22
Flow adhesion assays
Red blood cell adhesion to laminin 521 was measured under flow conditions using a capillary flow chamber. Recombinant laminin 521 (BioLamina) at 5 ng/mL was immobilized in Vena8 Endothelial+TM biochips (internal channel dimensions: length 20 mm, width 0.8 mm, height 0.12 mm). RBCs were perfused at 5.107 RBCs/mL for 5 minutes (min) at 0.5 dyn/cm2 and 5-min washouts were performed at 0.5, 1, 2, 3, 5, 7 dyn/cm2 using the ExiGoTM pump (Cellix Ltd., Dublin, Republic of Ireland). After each wash, adherent RBCs were counted in 6 representative areas along the centerline of the biochip using the AxioObserver Z1 microscope (10X objective) and AxioVision 4 analysis software (Carl Zeiss). Images of the same 6 areas were obtained throughout each exper- iment using the “Mark and Find” module of AxioVision analysis software.
Flow cytometry
Cell surface expression of Lu/BCAM and CD147 and percent- age of reticulocytes were determined using specific antibodies and Retic-CountTM (thiazole orange) reagent, respectively, using a BD FACScanto II flow cytometer (Becton-Dickinson), as described.23,24
Phosphorylation assays and western blot
Phosphorylation of Lu/BCAM was assessed in PV RBCs, as described.23,24 Briefly, RBCs were incubated in DMEM
(GlutaMAXTM I, 4500 mg/L D-glucose) without sodium pyruvate for 2 hours at 37°C, 0.5% CO2, centrifuged at 1500 rpm for 5 min, and suspended in 1 mL of the same DMEM containing 32P (160 mCi) overnight at 37°C, 0.5% CO2. RBCs were lysed for 45 min at 4°C with lysis buffer containing: 20mM Tris, 150mM NaCl, 5mM EDTA, 0.002% NaN3, 1% Triton X-100, 0.2% BSA, phosphatase (Sigma-Aldrich), and protease inhibitor cocktails (Roche Diagnostics). Lu/BCAM was immunopurified with F241 mAb and protein A-sepharose CL4B beads (Roche Diagnostics) overnight at 4°C. After electrophoresis and protein transfer, phos- phorylated proteins were detected and quantified with a FujiFilm BAS-1800 II PhosphorImager, using Image Reader BAS-1800 II v.1.8 and Multi Gauge, v.3.0 software, respectively (Fuji). Total Lu/BCAM was then revealed on the same membrane using biotinylated anti-Lu/BCAM antibody (R&D Systems) and ECL. Proteins were quantified using Chemidoc and Quantity One soft- ware.
Statistical analysis
Statistical analysis was performed with GraphPad Prism using Mann-Whitney test (Figures 1-3) and paired t-test (Figure 4): *P<0.05, **P<0.01, ***P<0.001 and ****P<0.0001.
Results
Altered membrane protein expression in RBCs of HC-treated patients
In our recent work, we showed abnormal expression of several proteins at the membrane of PV RBCs, with a high number of proteins from the endoplasmic reticulum, including calreticulin (Calr).19 To verify if HC treatment restores normal expression of these proteins, we per- formed a proteomic analysis with RBC ghosts from 3 patients before and during their treatment with HC (pre- post patients). Three hundred and seventy-five proteins were confidently identified, with a number of peptides that allowed 358 distinct protein quantification (Online Supplementary File 2). Among the deregulated proteins ini- tially reported,19 HC decreased the expression of several over-expressed proteins and increased the expression of those down-regulated (Table 1). Nevertheless, the treat- ment did not seem to restore a normal expression pattern of these proteins for all 3 patients when compared to con- trol (Table 1 and Online Supplementary Table S1). In addi- tion, the comparative analysis showed that HC deregulat- ed the expression of 53 proteins that had normal expres- sion before the treatment started, with overexpression of
haematologica | 2018; 103(6)
