
Page 100 - Haematologica June
P. 100
S. Gon et al.
cells. Both [OT-II x Rag1–/– x Ptendel] and the control TCR- deficient mice [Rag1–/– x Ptendel] (Online Supplementary Figure S2) developed T-cell lymphoblastic lymphomas (T-LBL) which were mostly restricted to the thymus (Figure 1A), over-expressed Bcl219 and, as previously described,17 were recurrently Notch1-dependent (Figure 1C). Indeed, we found that all [Rag1–/– x Ptendel] tumors tested (n=7) and 3 out of 7 [OT-II x Rag1–/– x Ptendel] tumors
were Notch1 activated. Of note, Notch1 activation does not impact latency of [OT-II x Rag1–/– x Ptendel] tumors (Online Supplementary Figure S3). Strikingly, in the [OT-II x Rag1–/– x Ptendel] model, the examined tumors (n=15) had lost surface expression of the OT-II transgene and were either TCRneg or TCRαβlow (Figure 1B), consistent with pre- vious observations.17 Molecular analysis of the transgenic β chain mRNA expression in the tumors revealed down-
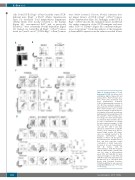
A
C
B
D
Figure 2. Counter-selection of T cells harboring H-Y TCR. (A) Spleen (left) and thymus (right) of typical H-Y and tumoral [H-Y x Ptendel] female mice. [H-Y x Ptendel] mice developed T-cell acute lymphoblastic leukemias (T-ALL) in approximately ten weeks (n =5). (B) Flow cytometry analysis of typical spleens from H-Y and tumoral [H-Y x Ptendel] female mice. (C) Flow cytometry analysis of typical disease- free thymus (left panels) and spleens (right panels) from young (4-week old) H-Y and [H-Y x Ptendel] female mice. Percentages of cells in depicted gates are indicated. Representative data of at least 3 experiments are shown. Dot plots show percentages of CD8 SP, H-Y+ CD8 SP or H-Y+ DP thymic cells and HY+ CD8 T cells from spleens of control H-Y (n= 7) and [H-Y x Ptendel] (n=7) female mice. (D) Pre- tumoral single positive (SP) thymo- cytes are partially blocked at the immature CD69+CD62Llow stage. Analysis of 4-week old disease-free (pre-tumoral) Ptendel and [HY x Ptendel] mice and their respective control counterparts is shown (representa- tive data of at least 3 experiments).
CD8 M: mature (CD69–CD62LHi); CD8 IM: immature CD8 SP (CD69+CD62LLo). Arrows indi- cate the stage of differentiation arrest (SP2 and CD8 IM). Dot plots show percentages of CD4 SP2 and CD8 IM T cells in the indicated back- grounds (n=5 or 6). Error bars show means with Standard Deviation. Statistical significance was assessed using Mann-Whitney test (**P<0.01; ***P<0.001).
CD8 SP
1002
haematologica | 2018; 103(6)
