
Page 76 - Haematologica Vol. 107 - September 2022
P. 76
ARTICLE - High tumor burden and response to blinatumomab A. Cabannes-Hamy et al.
Impact of pre-blinatumomab tumor burden on outcome
In order to address the impact of pre-blinatumomab tumor load on subsequent outcome, we first investigated the role of pre-blinatumomab MRD in the MRD+ cohort. Among the four patients who did not reach a complete MRD response after blinatumomab, two had a pre-blinatumomab MRD >1% (2/6, 33%) and two had MRD ≤1% (2/26, 8%; P=0.15). A high level of pre-blinatumomab MRD was significantly as- sociated with a lower RFS and OS (Figure 4A and B). The 3- year RFS was respectively 33%, 58% and 78% respectively
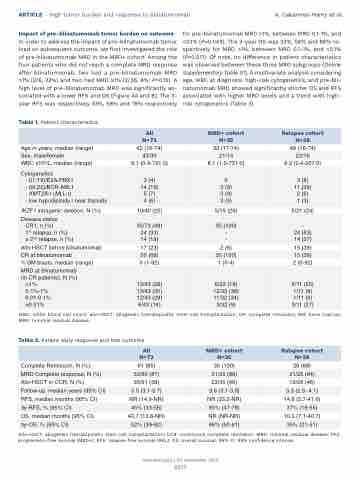
Table 1. Patient characteristics.
for pre-blinatumomab MRD >1%, between MRD 0.1-1%, and <0.1% (P=0.049). The 3-year OS was 33%, 58% and 86% re- spectively for MRD >1%, between MRD 0.1-1%, and <0.1% (P=0.011). Of note, no difference in patient characteristics was observed between these three MRD subgroups (Online Supplementary Table S1). A multivariate analysis considering age, WBC at diagnosis, high-risk cytogenetics, and pre-bli- natumomab MRD showed significantly shorter OS and RFS associated with higher MRD levels and a trend with high- risk cytogenetics (Table 3).
All N=73
MRD+ cohort N=35
Relapse cohort N=38
Age in years, median (range)
42 (16-74)
32 (17-74)
49 (16-74)
Sex, male/female
43/30
21/14
22/16
WBC x109/L, median (range)
8.1 (0.4-731.0)
8.1 (1.0-731.0)
8.2 (0.4-207.0)
Cytogenetics
- t(1;19)/E2A-PBX1
- t(9;22)/BCR-ABL1
- KMT2A-r (MLL-r)
- low hypodiploidy / near triploidy
3 (4) 14 (19) 5 (7) 4 (6)
0 3 (9) 3 (9) 3 (9)
3 (8) 11 (29) 2 (6) 1 (3)
IKZF1 intragenic deletion, N (%)
10/40 (25)
5/19 (26)
5/21 (24)
Disease status
CR1, n (%)
1st relapse, n (%)
≥ 2nd relapse, n (%)
35/73 (48) 24 (33) 14 (19)
35 (100) -
-
-
24 (63) 14 (37)
Allo-HSCT before blinatumomab
17 (23)
2 (6)
15 (39)
CR at blinatumomab
50 (68)
35 (100)
15 (39)
% BM blasts, median (range)
0 (1-92)
1 (0-4)
2 (0-92)
MRD at blinatumomab (in CR patients), N (%)
>1% 0.1%-1% 0.01-0.1% <0.01%
12/43 (28) 13/43 (30) 12/43 (28) 6/43 (14)
6/32 (18) 12/32 (38) 11/32 (34) 3/32 (9)
6/11 (55) 1/11 (9) 1/11 (9) 3/11 (27)
WBC: white blood cell count; allo-HSCT: allogeneic hematopoietic stem cell transplantation: CR: complete remission; BM: bone marrow; MRD: minimal residual disease.
Table 2. Patient early response and late outcome.
All N=73
MRD+ cohort N=35
Relapse cohort N=38
Complete Remission, N (%)
61 (85)
35 (100)
26 (68)
MRD Complete response, N (%)
52/60 (87)
31/35 (89)
21/25 (84)
Allo-HSCT in CCR, N (%)
35/61 (58)
23/35 (66)
12/26 (46)
Follow-up, median years (95% CI)
3.5 (3.1-3.7)
3.6 (3.1-3.8]
3.3 (2.5- 4.1)
RFS, median months (95% CI)
NR (14.9-NR)
NR (33.2-NR)
14.6 (5.7-41.6)
3y-RFS, % (95% CI)
45% (33-56)
65% (47-78)
37% (19-55)
OS, median months [95% CI)
40.7 (13.8-NR)
NR (NR-NR)
10.3 (7.1-40.7)
3y-OS, % (95% CI)
52% (39-62)
68% (50-81)
35% (21-51)
Allo-HSCT: allogeneic hematopoietic stem cell transplantation; CCR: continuous complete remission; MRD: minimal residual disease; PFS: progression-free survival (MRD+); RFS: relapse-free survival (REL); OS: overall survival; 95% CI: 95% confidence interval.
Haematologica | 107 September 2022
2075
