
Page 69 - Haematologica May 2022
P. 69
Defective eNOS and angiogenesis in GATA2 R398W
AB
CD
E
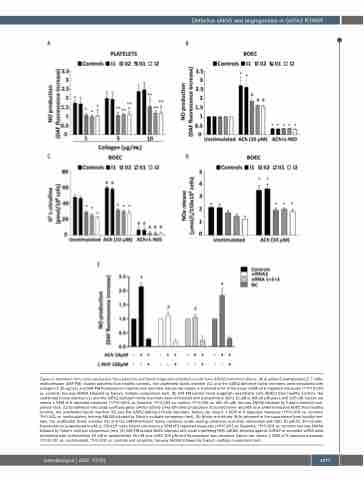
Figure 3. Impaired nitric oxide production from platelets and blood outgrowth endothelial cells from GATA2-mutated patients. (A) 4-amino-5-methylamino-2',7'-diflu- orofluorescein (DAF-FM)–loaded platelets from healthy controls, the unaffected family member (I1) and the GATA2-deficient family members were stimulated with collagen (1-10 μg/mL) and DAF-FM fluorescence intensity was recorded. Values are means ± standard error of the mean (SEM) of 6 repeated measures (**P<0.001 vs. controls; two-way ANOVA followed by Tukey’s multiple comparison test). (B) DAF-FM-loaded blood outgrowth endothelial cells (BOEC) from healthy controls, the unaffected family member (I1) and the GATA2-deficient family members were stimulated with acetylcholine (ACh) 10 μM or ACh10 μM plus L-NIO 100 μM. Values are means ± SEM of 6 repeated measures (*P<0.0001 vs. baseline, #P<0.005 vs. control, +P<0.005 vs. ACh 10 μM; two-way ANOVA followed by Tukey’s multiple com- parison test). (C) Endothelial nitric oxide synthase gene (eNOS) activity ((3H)L-Citrulline production) of acetylcholine- and ACh plus L-NIO-stimulated BOEC from healthy controls, the unaffected family member (I1) and the GATA2-deficient family members. Values are means ± SEM of 6 repeated measures (*P<0.001 vs. controls, #P<0.001 vs. unstimulated, two-way ANOVA followed by Tukey’s multiple comparison test). (D) Nitrite and nitrate (NOx) released in the supernatant from healthy con- trols, the unaffected family member (I1) and the GATA2-deficient family members under resting conditions and after stimulation with ACh 10 μM for 30 minutes. Concentration is expressed in μM /L/150x103 cells. Values are means ± SEM of 6 repeated measures (+P<0.001 vs. Baseline, *P<0.001 vs. controls; two-way ANOVA followed by Tukey’s multiple comparison test). (E) DAF-FM-loaded BOEC silenced with small interfering RNA (siRNA) directed against GATA2 or scramble siRNA were stimulated with acetylcholine 10 μM or acetylcholine 10 μM plus L-NIO 100 μM and fluorescence was recorded. Values are means ± SEM of 6 repeated measures (*P<0.001 vs. unstimulated, #P<0.001 vs. controls and scramble, two-way ANOVA followed by Tukey’s multiple comparison test).
haematologica | 2022; 107(5)
1077
