
Page 40 - Haematologica May 2022
P. 40
D. Niederwieser et al.
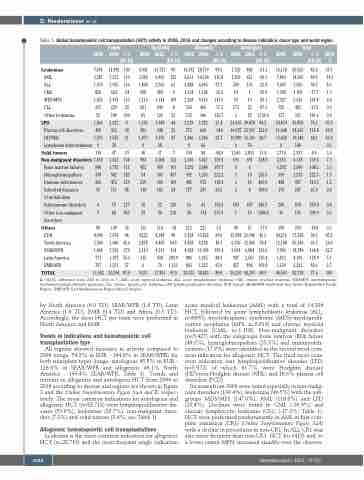
Table 1. Global hematopoietic cell transplantation (HCT) activity in 2006, 2016 and changes according to disease indication, donor type and world region.
Family Unrelated Allogeneic Autologous Total
2006 2016 Δ% 2006 2016 Δ% 2006 2016 Δ% 2006 2016 Δ% 2006 2016 Δ% 2016
Leukemias
AML
ALL
CML
MDS/MPS
CLL
Other leukemias
7,491 3,587 1,679 826 1,052 295 52 1,863
(06-16)
14,992 100 7,531 110 3,965 136
624 -24 2,472 135 220 -25 180 246
6,901 3,024 1,809 508 1,216 261 83 1,356
(06-16)
13,727 99 14,392 28,719
(06-16) (06-16)
99.5 1,726 844 -51.1 16,118 116.8 1,269 631 -50.3 7,880 97.7 209 155 -25.8 3,697 -16.9 14 1 -92.9 1,348
29,563 14,965 7,050 1,109
(06-16) %
83.4 35.7 89.9 18.1 90.7 8.5
-17.7 1.3 141.8 6.8 -33.9 0.6 141.6 0.4
76.3 53.0 112.8 29.5 44.1 23.4
0.2 8.4 3.6 139.6 7.3 108.2 3.3 222.3 1.5 120.3 1.2 65.9 0.4
239.0 0.8 394.9 0.2
-18.8 0.3 54.3 45.2 65.3 24.4 164.8 22.7
2,023 9
Plasmacelldisorders 490 312 -36 283 348 23
306 3,972
84.2 122.0 46.7
11.4 258.0
233.3 400.0 100.0
246.2 1,800.0
-71.9 45.5 78.4
6,803 125 2,930 62
6,611 3,488 1,334 2,268 556 135 3,219
14,334 6,895 1,108 5,616
484 3,144 240 126
-5 159 -8 52
147.6 59 10 -83.1 2,327 5,626
460 -17.3 173 22 -87.3
126.7 2 25 1,150.0
729 482
137 331 24,874 43,850 11,448 24,361 13,426 19,349
0 140 2,710 2,937 2,553 6,118 1,292 2,690
395 1,273 448 987 179 297
200 678 39 193
308 250 24,216 37,368 12,188 20,144
LPD
1,949 44
23.4 21,655 39,878 773 660 -14.6 10,675 23,701
HD/NHL 1,373
Lymphoma other/unknown 0 Solid tumors 110 Non-malignant disorders 1,458
1,673 21 38
47 -57 3,423 134 1,775 111
1,073 1,573 47 0 28
40 37 902 2,004 452 909
2,446 0 150 2,360 1,292 392 445 177
16 38
212 9,128 5,458 4,058 886
3,246 66 84 5,427 2,684 1,263 972 293
41 174
223 15,422 8,138 11,905 1,635
32.7 10,980 16,103 0 74
-44,0 2,560 2,853 139.4 193 691 107.7 0 6 222.2 3 10 118.4 3 15 65.5 2 4
156.3 184 637 357.9 1 19
5.2 96 27 69.0 15,088 21,946 49.1 6,730 12,006
193.4 3,038 6,884 84.5 947 2,561
Bone marrow failures 840 Hemoglobinopathies 338 962
-7 122 101 457 109 54
120 210
132 114
4,222 8,348 98 2,878 4,458 54.9 2,110 4,513 114
185 54
301 239 500 118 182
10 22 29 90
Immune deficiencies Inherited diseases
of metabolism Autoimmune disorders Other non-malignant disorders
Others
EUR
North America SEAR/WPR Latin America EMR/AFR
TOTAL
206 472 59 111
6 19 9 84
129 88
217 833
80 109
4,906 7,074 44 2,580 3,680 42.6 1,948 7,392 279
771 1,197 55.3
128.9 5.1 68.9 46,563 82,718 77.6 100
36
-14
115 438 280.9 797 1,251 57 6 74 1,133
803 1,325 65.0 427 896 11,002 20,594 87.0 9,331 17,831 91.0 20,333 38,425 89.0 26,230 44,293
126.6 7,096
170.4 1,833
109.8 1,230 2,221 80.6 2.7
18,789 4,196
Δ (06/16) Difference from 2006 to 2016 in %; AML: acute myeloid leukemia; ALL: acute lymphoblastic leukemia; CML: chronic myeloid leukemia; MDS/MPS: myelodysplastic syndrome/myeloproliferative syndrome; CLL: chronic lymphocytic leukemia; LPD: lymphoproliferative disorders; EUR: Europe; SEAR/WPR: South East Asia Pacific Region/West Pacific Region; EMR/AFR: East Mediterranean Region/African Region.
by North America (6.0 TD), SEAR/WPR (1.9 TD), Latin America (1.6 TD), EMR (0.4 TD) and Africa (0.3 TD). Accordingly, the most HCT per team were performed in North America and EMR.
Trends in indications and hematopoietic cell transplantation type
All regions showed increases in activity compared to 2006 (range, 54.3% in EUR - 164.8% in SEAR/WPR) for both transplant types (range, autologous 45.5% in EUR - 126.6% in SEAR/WPR and allogeneic 49.1% North America - 193.4% SEAR/WPR; Table 1). Trends and increase in allogeneic and autologous HCT from 2006 to 2016 according to disease and regions are shown in Figure 3 and the Online Supplementary Figure S4A and B, respec- tively. The most common indications for autologous and allogeneic HCT (n=82,718) were lymphoproliferative dis- eases (53.0%), leukemias (35.7%), non-malignant disor- ders (7.3%) and solid tumors (3.6%; see Table 1).
Allogeneic hematopoietic cell transplantations
Leukemia is the most common indication for allogeneic HCT (n=28,719) and the most frequent single indication
acute myeloid leukaemia (AML) with a total of 14.334 HCT, followed by acute lymphoblastic leukemia (ALL; n=6895), myelodysplastic syndrome (MDS)/myeloprolif- erative neoplasms (MPS; n=5,616) and chronic myeloid leukemia (CML; n=1,108). Non-malignant disorders (n=5,427) with the subgroups bone marrow (BM) failure (49.5%), hemoglobinopathies (23.3%) and immunodefi- ciencies (17.9%) were identified as the second most com- mon indication for allogeneic HCT. The third most com- mon indication was lymphoproliferative disorder (LPD; n=3,972) of which 81.7% were Hodgkin disease (HD)/non-Hodgkin disease (NHL) and 16.6% plasma cell disorders (PCD).
Increases from 2006 were noted especially in non-malig- nant disorders (139.4%), leukemias (99.5%) with the sub- groups MDS/MPS (147.6%), AML (116.8%) and LPD (23.4%). Declines were noted in CML (-16.9%) and chronic lymphocytic leukemia (CLL) (-17.3%; Table 1). HCT were performed predominantly in AML in first com- plete remission (CR1) (Online Supplementary Figure S4A) with a decline in procedures in non-CR1. In ALL CR1 was also more frequent than non-CR1. HCT for MDS and, to a lower extent MPN, increased steadily over the observa-
1048
haematologica | 2022; 107(5)
