
Page 175 - Haematologica May 2022
P. 175
Letters to the Editor
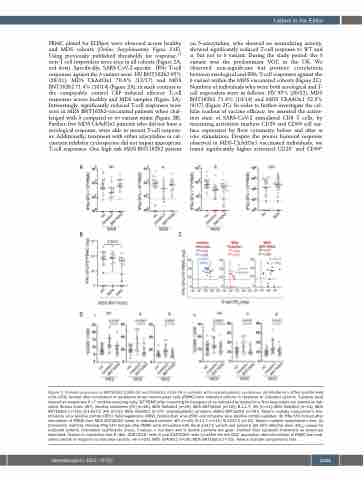
PBMC plated for ELISpot were observed across healthy and MDS cohorts (Online Supplementary Figure S1E). Using previously published thresholds for response,1,2 non-T cell responders were seen in all cohorts (Figure 2A; red dots). Specifically, SARS-CoV-2-specific IFNg T-cell responses against the δ variant were: HV BNT162b2 95% (20/21); MDS ChAdOx1 70.6% (12/17) and MDS BNT162b2 71.4% (10/14) (Figure 2A); in stark contrast to the comparable control CEF induced effector T-cell responses across healthy and MDS samples (Figure 2A). Interestingly, significantly reduced T-cell responses were seen in MDS BNT162b2-vaccinated patients when chal- lenged with δ compared to wt variant strain (Figure 2B). Further, five MDS ChAdOx1 patients who did not have a serological response, were able to mount T-cell respons- es. Additionally, treatment with either azacytidine or cal- cineurin inhibitor cyclosporine did not impair appropriate T-cell responses. One high risk MDS BNT162b2 patient
on 5-azacytidine, who showed no neutralizing activity, showed significantly reduced T-cell response to WT and a, but not to δ variant. During the study period, the δ variant was the predominant VOC in the UK. We observed non-significant but positive correlations between serological and IFNg T-cell responses against the δ variant within the MDS vaccinated cohorts (Figure 2C). Numbers of individuals who were both serological and T- cell responders were as follows: HV 95% (20/21), MDS BNT162b2 71.4% (10/14) and MDS ChAdOx1 52.9% (9/17) (Figure 2C). In order to further investigate the cel- lular readout of vaccine efficacy, we assessed the activa- tion state of SARS-CoV-2 stimulated CD8 T cells, by measuring activation markers CD25 and CD69 cell sur- face expression by flow cytometry before and after in vitro stimulation. Despite the poorer humoral response observed in MDS-ChAdOx1 vaccinated individuals, we found significantly higher activated CD25+ and CD69+
A
BC
D
Figure 2. Cellular responses to BNT162b2 COVID-19 and ChAdOx1 nCoV-19 in patients with myelodysplastic syndromes. (A) Interferon g (IFNg) spot-forming units (SFU) formed after stimulation of peripheral blood mononuclear cells (PBMC) from indicated cohorts in response to indicated variants. Samples were classed as responders if >7 cytokine secreting cells/106 PBMC after correcting for background; as indicated by dashed line. Non-responders are colored as indi- cated. Wuhan strain (WT); (healthy volunteers [HV] [n=26]; MDS ChAdOx1 [n=20]; MDS BNT162b2 [n=15]); B.1.1.7; (HV [n=11]; MDS ChAdOx1 [n=11]; MDS BNT162b2 [n=15]); B.1.617.2; (HV [n=21]; MDS ChAdOx1 [n=17]; myelodysplastic syndrome (MDS) BNT162b2 [n=14]). Tukey’s multiple comparison’s test. Influenza virus positive control (CEF)= Cytomegalovirus (CMV), Epstein-Barr virus (EBV) and influenza virus positive control peptides: (B) IFNγ SFU formed after stimulation of PBMC from MDS BNT162b2 cases to indicated variants. WT (n=15); B.1.1.7 (n=11); B.1.617.2 (n=14). Tukey’s multiple comparison’s test. (C) Correlation matrices showing IFNg SFU formed after PBMC were stimulated with the B.1.617.2 variant and paired S IgG 50% effective dose (ED50) values for indicated cohorts. Correlation coefficients (rho;r), P-values, n numbers and % double positivity are given. Dashed lines represent thresholds as previously described. Pearson’s correlation test. E (i&ii). CD8+CD25+ cells (i) and CD8+CD69+ cells (ii) within the live CD3+ population after stimulation of PBMC from indi- cated cohorts in response to indicated variants. HV (n=26); MDS ChAdOx1 (n=20); MDS BNT162b2 (n=15). Tukey’s multiple comparison’s test.
haematologica | 2022; 107(5)
1183
