
Page 74 - 2022_03-Haematologica-web
P. 74
O. Benjamini et al.
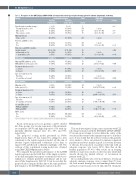
Table 2. Response to the BNT162b2 mRNA COVID-19 vaccine based on type of prior therapy given for chronic lymphocytic leukemia.
Variable
Prior therapies, median (range) Treatment- naive, n (%)
One, n (%)
Two or more, n (%)
Ongoing therapy None, n (%)
Previous antiCD20, n (%) No
Yes
Time since anti-CD20, months, median (range)
≥12 months, n (%) < 12 months, n (%)
BTK inhibitor
Ongoing BTK inhibitors, n (%) BTK inhibitors in the past, n (%)
Treatment duration, n (%) < 2 years
≥ 2 years
Line of treatment, n (%) First line
Second line or beyond
BCL2 inhibitor
Ongoing, n (%) In the past, n (%)
Treatment duration, n (%) ≤ 1 year
> 1 year
Line of treatment, n (%) First line
Second line or beyond
+/- anti CD20, n (%) Without antiCD20 With anti-CD20
IVIG*, n (%) No
Yes
Serological response
Total Odds ratio (95% CI)
n=373
1
158 1 (ref)
120 0.26 (0.16-0.43)
95 0.26 (0.15-0.45)
253 1 (ref)
197 1 (ref)
143 0.37 (0.23-0.58)
36
92 1 (ref)
39 0.1 (0.02-0.45)
n=106
79 1 (ref)
27 2.73 (1.03-7.21)
54 1 (ref)
52 0.68 (0.27-1.71)
53 1 (ref)
53 0.5182 (0.2-1.32)
Positive n=160 (43%)
0 (0-4) 97 (61%) 35 (29%) 28 (29%)
143 (57%)
98 (50%) 38 (27%)
48 (10-102) 32 (35%) 2 (5%)
n=24(23%)
14 (18%) 10 (37%)
14 (26%) 10 (19%)
15 (28%) 9 (17%)
n=15 (24%)
2 (6%) 13 (46%)
8 (19%) 7 (35%)
8 (24%) 7 (25%)
8 (62%) 7 (14%)
145 (46%) 15 (28%)
Negative n=213 (57%)
1 (0-6) 61 (39%) 85 (71%) 67 (71%)
110 (43%)
99 (50%) 105 (73%)
27 (1-132) 60 (65%) 37 (95%)
n=82(77%)
65 (82%) 17 (63%)
40 (74%) 42 (81%)
38 (72%) 44 (83%)
P-value <10-5
<10-3 <10-5
0.0001
0.142 0.0004
0.0384 0.4103 0.1638
0.0002 0.1703 0.893 0.0004 0.0137
n=47(76%) n=62
32 (94%) 15 (54%)
34 (81%) 13 (65%)
26 (76%) 21 (75%)
5 (38%) 42 (86%)
172 (54%) 39 (72%)
34 28
42 20
34 28
13 49
317 54
1 (ref) 13.87 (2.77-69.38)
1 (ref) 2.2885 (0.69-7.59)
1 (ref) 1.0833 (0.34-3.48)
1 (ref) 0.1042 (0.03-0.41)
1 (ref) 0.46 (0.24-0.86)
*Given monthly. 95% CI: 95% confidence interval; IVIG: intravenous immunoglobulins.
Based on the proposed score, patients could be divided into three groups: low vaccine responsive (<20), intermedi- ate responsive (20-70) and high responsive (>70) with sig- nificantly different response rates: 6%, 35% and 75% respectively.
The proposed scoring model presented in Online Supplementary Figure S1 was formed by adding two new constraints to the logistic regression model: (A) the sum of absolute logistic transformed coefficients is less than or equal to 100; and (B) each coefficient is multiples of 10. The solution of this constrained scoring model was obtained using IBM CPLEX Optimization Studio.
We compared the predictive performance of the LASSO logistic regression model with that of the simple seven-fac- tor models and applied ten repeats of stratified 10-fold cross- validation to estimate predictive performance and its vari- ance (Online Supplementary Table S3). It can be seen that the proposed risk scoring model has almost the same predictive performance as the LASSO logistic regression model.
Discussion
This study investigated a large series of patients with CLL following vaccination with the BNT162b2 mRNA COVID- 19 vaccine in an attempt to better define the safety of the vaccine and the extent of the immune response to it in these cases. It was found that the adverse events in CLL patients were similar to those encountered in immunocompetent populations and were mainly of grade 1-2 severity. In terms of efficacy, the proportion of patients with CLL with an adequate response was lower (43%) than that in the healthy population (97.4%).2 Our results are in keeping with those of previous studies on other vaccines which had already shown the limited efficacy of vaccination in patients with CLL.10-15
In our study patients who were more likely to develop an adequate immune response were younger than 70 years old, had normal hemoglobin and immunoglobulin levels and had not previously received CLL-directed treatment.
630
haematologica | 2022; 107(3)
