
Page 186 - 2022_03-Haematologica-web
P. 186
Letters to the Editor
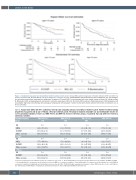
Figure 1. Unadjusted (top panel) and standardized (bottom panel) overall survival among MCL patients diagnosed in Sweden between 2007 and 2017, by frontline treatment (BR, R-CHOP, MCL2) and age at diagnosis (<70 and ≥70 years). Standardization was performed over year of diagnosis, sex, age at diagno-
sis, and performance status (separately for age groups). In patients ≥70 years, MCL2 is not presented due to the limited number of cases. OS: overall survival; R: Rituximab; CHOP: cyclophosphamide, doxorubicin, vincristine, prednisone; MCL2/3: the Nordic MCL2 protocol (R-alternating maxi CHOP/cytarabine with consolidative high-dose chemotherapy with autologous hematopoetic cell transplant). Number at risk table denotes selected time points of estimates (0.3; 2; 4; 6; 8; 10 years).
Table 2. Hazard ratio (HRs) with 95% confidence intervals (CI) comparing all-cause mortality in relation to given frontline treatment among all patients (top panel) and by age (<70 and ≥70 years) (bottom panel). The analysis included univariable (a) and multivariable models (b- e). For categorical variables, female sex, WHO PS 0-1 and MIPI low risk were reference groups, respectively. Age and LDH were treated as continuous variables.
Treatment regimen HRa (95% CI) HRb (95% CI) HRc (95% CI) All(n) 756 595 607
607
BR 1.00 1.00 1.00 MCL2 0.49 (0.37-0.66) 1.06 (0.71-1.56) 0.66 (0.48-0.91)
HRd (95% CI)
1.00 0.71 (0.51-0.98)
R-CHOP 1.51 (1.15–2.06) 1.10 (0.73-1.66) 1.07 (0.73-1.58) 1.23 (0.84-1.80)
Other systemic 1.49 (1.15-1.91) 1.41 (1.02-1.92) 1.37 (1.01-1.86) 1.44 (1.06-1.95)
<70yrs
BR 1.00 1.00 1.00 1.00 MCL2 0.77 (0.44-1.33) 0.79 (0.42-1.46) 0.88 (0.49-1.60) 0.92 (0.5-1.67)
R-CHOP 1.68 (0.82–3.43) 1.23 (0.50-3.03) 1.10 (0.47-2.58) 1.08 (0.46-2.55)
Other systemic 1.46 (0.78-2.75) 1.78 (0.86-3.70) 1.51 (0.74-3.08) 1.34 (0.65-2.74)
≥70yrs
BR 1.00 1.00 1.00 1.00 R-CHOP 1.56 (1.10–2.19) 1.03 (0.65-1.64) 1.10 (0.72-1.69) 1.33 (0.87-2.02)
Other systemic 1.56 (1.19-2.06) 1.55 (1.10-2.18) 1.36 (0.97-1.90) 1.49 (1.07-2.07)
a) From Cox regression model adjusted for time since diagnosis (time scale).b) From multivariable Cox regression model adjusted for age,sex,WHO PS,WBC and LDH. c) From multivariable Cox regression model adjusted for sex and MIPI as a continuous variable. d) From multivariable Cox regression model adjusted for sex and MIPI as a categorical variable including high and intermediate risk versus low risk. WHO PS:World Health Organization performance status;WBC:white blood cell count;LDH:lac- tate dehydrogenase; MIPI: Mantle cell lymphoma International Prognostic Index; HR: high-risk; IMR: intermediate risk.
742
haematologica | 2022; 107(3)
