
Page 150 - 2022_03-Haematologica-web
P. 150
A.N. Bastidas Torres et al.
Figure 2. JAK2 fusions are recurrent in a complex landscape of rearrangements. (A) Number of genomic rearrangements per patient. The distribution of inter- and intrachromosomal rearrangements per patient is shown too. (B) Distribution of inter- and intrachromosomal rearrangements (cohort). (C) Distribution of genomic rearrangements based on the type of DNA sequences (genic, nongenic) involved in the event (cohort). (D) Circos plot showing a chromoplexy-like event in patient AEC10 that mediated the loss of multiple genomic regions in chromosomes 1, 9 and 12, several of which enclosed established tumor suppressor genes. (E) Distribution of rearranged genes according to the protein class their encoded proteins belong to. (F, G and H) Genomic rearrangements generated self-activating JAK2 fusions in pcAECyTCL as evidenced in patients (F) AEC4, (G) AEC9 and (H) AEC11. (i) Circos plots showing interchromosomal rearrangements involving chromo- some 9 in patients with pcAECyTCL. JAK2 rearrangements were the common denominator between chromosome 9 events observed in these individuals. (ii) Validation of translocation breakpoints at JAK2 by Sanger sequencing in pcAECyTCL patients. Breakpoints occurred between exon 16 and exon 17 in all cases. (iii) Rearrangements involving JAK2 led to the formation of fusion genes encoding the tyrosine kinase domain of JAK2 and the oligo/dimerization domains of the fusion partners (KHDRBS1: Qua1 domain, PCM1: coiled-coil domains, TFG: PB1 domain), conferring the resulting chimeric protein the ability to self-activate. (I) In addition to acquiring self-activation ability, JAK2 fusions can also experience increased expression in comparison to wild-type JAK2. (i) Image of break-apart fluorescence in situ hybridization (FISH) analysis showing a JAK2 rearrangement in patient AEC4. Scale bar, 10 mm. (ii) Active expression of fusion gene KHDRBS1-JAK2 in patient AEC4 was detected by RNA sequencing (chimeric reads shown in diagram). (iii) Plot showing mean read coverage across all exons of JAK2 in patient AEC4. RNA expression between exon 17 and exon 25, the part of JAK2 under the transcriptional control of KHDRBS1’s promoter and encoding its tyrosine kinase domain, is considerably higher compared to RNA expression between exon 1 and exon 16. The red line indicates the breakpoint position. pcAECyTCL: primary cutaneous CD8+ aggressive epidermotropic cytotoxic T-cell lymphoma.
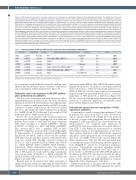
Table 1. Identical variants in JAK and STAT proteins reported in other hematological malignancies.
Gene Variant
JAK2 p.L393V JAK3 p.M511I JAK3 p.R657W STAT5B p.S434L STAT5B p.N642H STAT5B p.Y665F
STAT5B p.P702S
Type
Germline Somatic Somatic Somatic Somatic Somatic
Somatic
Neoplasm
PV15,28
T-PLL, AML, JMML, NKTCL13,27,28
T-ALL12,28 GoF T-ALL17 Unknown
Effect
GoF
GoF Possibly GoF
Functionally validated
Yes15 Yes13 Yes12
No Yes14
Yes14 No
Affected patient
AEC3 AEC12 AEC5 AEC8 AEC1, AEC6 AEC7 AEC2
Slightly HS GoF
T-ALL, T-LGL, T-PLL, NKTCL, EATL14,27,28 T-LGL, T-PLL, ALCL ALK–, NKTCL14,27,28 T-PLL16
GoF: gain-of-function; HS: hypersensitive; ALCL ALK–: ALK– anaplastic large cell lymphoma; AML: acute myeloid leukemia; EATL: enteropathy-associated T-cell lymphoma; JMML: juvenile myelomonocytic leukemia; PV: polycythemia vera; T-ALL: T-cell acute lymphoblastic leukemia; T-LGL: T-cell large granular lymphocytic leukemia; T-PLL: T-cell prolymphocytic leukemia; NKTCL: extranodal natural killer T-cell lymphoma.
in our patients using methylation-specific melting curve analysis (MS-MCA) and found no evidence of this inacti- vation mechanism (Online Supplementary Figure S9).
Pathogenic small-scale mutations in JAK-STAT pathway genes predominate in pcAECyTCL
The discovery of recurrent structural alterations affect- ing principally genes involved in the cell cycle, chromatin regulation and the JAK-STAT pathway (via JAK2) prompt- ed us to search for pathogenic indels and SNV in exonic sequences of genes with roles in the aforesaid cellular processes and additional signal transduction pathways (i.e., MAPK, NF-κB, PI-3-K/Akt and T-cell receptor [TCR] pathways) (Online Supplementary Table S7).
Besides the seven patients with structural alterations impacting the JAK2-SH2B3 signaling axis, four additional patients were found to carry bona fide gain-of-function SNV either in JAK3 (i.e., AEC5: p.R657W12; AEC12: p.M511I13) or STAT5B (i.e., AEC1 and AEC6: p.N642H14). Also, patient AEC3 bore a germline SNV in JAK2 (p.L393V15) which has been reported to render JAK2 slight- ly hypersensitive to cytokine stimulation (EPO ligand) (Figures 4A, 5A and B; Table 1). Moreover, two patients with JAK2 fusions and three patients with SH2B3 dele- tions also carried SNV affecting conserved residues in STAT3 (i.e., AEC4: p.H19R; AEC9: p.G604A) and STAT5B (i.e., AEC2: p.P702S16; AEC7: p.Y665F14; AEC8: p.S434L17), respectively (Online Supplementary Figure S6). Similarly, three patients carrying (putative) gain-of-function SNV in JAK or STAT genes also had indels leading to premature stop codons either in SH2B3 (i.e., AEC2: p.L201Sfs*78; AEC6: p.V35Afs*154) or SOCS1 (i.e., AEC5: p.S71Rfs*14) (Figures 4A and B, 5A).
Overall, nine of 12 patients had either structural or small-scale genetic alterations impacting the JAK2-SH2B3 signaling axis whereas the remaining three patients carried
pathogenic indels/SNV in other JAK-STAT pathway genes (Figures 4A and B, 5C). In addition, cancer genes involved in the cell cycle (i.e., TP53) and chromatin regulation (i.e., ARID1A, KMT2D, NCOR1) were found to be recurrently impacted either by truncating mutations (i.e., nonsense, frameshift) or SNV predicted as deleterious (Figure 4A). We also observed 34 additional patient-specific small-scale mutations of unknown significance in reputable cancer genes (Online Supplementary Table S6).
Transcriptome analysis uncovers upregulation of JAK2 signaling in pcAECyTCL
At present it is widely accepted that malignant T cells in pcAECyTCL derive from CD8+ T cells;1 however, to date no specific CD8+ T-cell subtype has been proposed as the cell of origin of this lymphoma. Since a hallmark of malignant T cells in pcAECyTCL is their distinctive epi- dermotropism,3,4 we compared gene expression in pcAECyTCL with gene expression in normal skin-resi- dent CD8+ T cells, which are characterized by a marked preferential tropism to the epidermal layer of the skin.18 This analysis identified 1,603 differentially expressed (DE) genes (1,076 upregulated, 527 downregulated, false discovery rate [FDR] <0.01) in the disease (Figure 6A; Online Supplementary Table S8). We next performed gene set enrichment analysis (GSEA) using annotated gene sets from MSigDB to search for deregulated pathways/ processes. Upregulated canonical signaling profiles included the JAK-STAT pathway (via STAT3, and to a lesser extent, via STAT5) and the TNF-α/NF-κB pathway. In addition, pcAECyTCL was characterized by the upreg- ulation of the cell cycle (i.e., E2F targets, G2/M check- point, mitotic spindle) and high inflammatory response (Figure 6B; Online Supplementary Table S18).
Further examination of DE genes involved in the JAK- STAT pathway revealed that JAK2 signaling was specifi-
706
haematologica | 2022; 107(3)
