
Page 97 - 2022_02-Haematologica-web
P. 97
CD38 CAR-NK cells targeting AML
Results
CD38 chimeric antigen receptor expression enhances KHYG-1 acute myeloid leukemia targeting
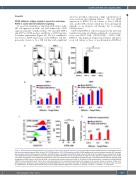
To assess the feasibility of targeting CD38 with a CAR- NK cell approach in AML, we first defined the CD38 expression profile of AML cell lines. We classified THP-1 and U937 as CD38-positive, and KG1a as CD38-negative for further experiments (Figure 1A). We also confirmed a low level of CD38 expression on the KHYG-1 cell line, previously shown to be a NK cell line with significant
A
cytotoxic potential, expressing a high concentration of active perforin and signaling kinases.19 The low CD38 expression of KHYG-1 is in contrast to that of NK-92 cells, another NK cell line which has been investigated clinically as an adoptive cell therapy, but is strongly CD38-positive.18
CD38 CAR-KHYG-1 cells were generated by retroviral transduction using an ‘affinity-optimized’, second-gener- ation anti-CD38 CAR (CD3ζ-CD28).13 CD38 CAR- KHYG-1 cells displayed similar characteristics and kinet- ics in cell culture as those of mock-transduced KHYG-1
B
CD
Figure 1. Affinity-optimized CD38 CAR-KHYG-1 cell cytotoxicity against acute myeloid leukemia cell lines. (A) Histograms depict CD38 expression of the KHYG-1 NK cell line and acute myeloid leukemia (AML) cell lines THP-1 (CD38-positive), U937 (CD38-positive) and KG1a (CD38-negative) with mean fluorescence intensity (MFI) indicated. Bars represent relative CD38 expression of KHYG-1 and AML cell lines (n=3 individual repetitions). Mean values for AML cell lines compared by an unpaired t-test. (B) Bar chart depicting the specific cytotoxicity of mock-transduced and CD38 CAR-KHYG-1 cells at varying effector to target (E:T) ratios against the CD38-positive cell lines THP- 1 and U937. Comparisons of four independent experiments made by an unpaired t-test at each effector to target (E:T) ratio. (C) Representative histograms depicting CD38 upregulation and MFI values in KG1a cells after 48 h of treatment with all-trans retinoic acid (ATRA) at 10 nM and 20 nM concentrations, compared to dimethylsulfoxide (DMSO) control treated KG1a cells. The bar chart summarize data from four independent experiments with comparisons by one-way analysis of variance. (D) Bar chart depicting specific cytotoxicity of mock-transduced and CD38 CAR-KHYG-1 cells in co-culture with 48 h, 10 nM ATRA-pretreated KG1a cells at varying E:T ratios (summary of 4 experiments). Error bars indicate standard error of mean (SEM). Statistical significance is defined as *P≤0.05, **P≤0.01, ***P≤0.001, ****P≤0.0001.
haematologica | 2022; 107(2)
439
