
Page 120 - 2022_02-Haematologica-web
P. 120
T. Pincez et al.
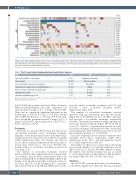
Figure 3. Immunopathological manifestations and other associated manifestations. Individual occurrence of autoimmune neutropenia, clinical immunopathological manifestations (cIM), biological IM (bIM), atopy, severe or recurrent infections, and malignancies. Each column represents a patient. The patients are ordered accord- ing to their cIM, from the most (lymphoproliferation) to the least (hematological, other) frequent. Hypoγ: hypogammaglobulinemia; SLE: systemic lupus erythemato- sus; ALPS: autoimmune lymphoproliferative syndrome.
Table 2. Most frequent clinical immunopathological manifestations diagnosis.
cIM
Superficial (palpable) adenopathies
Splenomegaly
Deep (abdominal or thoracic) adenopathies Granulomatous–lymphocytic interstitial lung disease Cutaneous lupus erythematosus involvement Autoimmune hepatitis
Subtentorial inflammatory lesions
n(%) cIM
n (%)
5 (3) 5 (3) 5 (3) 4 (3) 4 (3) 4 (3) 4 (3)
61 (40) 49 (33) 16 (11) 16 (11) 8 (5)
7 (5) 7 (5)
Lymphoid enteropathy Chronic gastritis Polyarthritis Vitiligo Eczema Keratitis Uveitis
Diagnosis present in at least four patients are shown and ordered by frequency. Complete diagnosis list is provided in the Online Supplementary Table S2. cIM: clinical immunopathological manifestation.
0-4], P=0.008) and a trend toward more bIM as shown by Wilcoxon–Mann–Whitney sum ranks comparison but same medians (1 [range, 0-3] vs. 1 [range, 0-2], P=0.029). There was no statistically significant difference in the median time to ITP CR (4.7 years vs. 8.0 years, P=0.26) and to AIHA CR (5.5 years vs. 5.5 years, P>0.9), the num- ber of second-line treatment received (3 [range, 0-9] vs. 2 [range, 0-6]; P=0.057) and mortality (two of 26 [7.7%] vs. three of 40 [7.5%]; P>0.9).
Treatments
All except two patients (98.6%) had received at least one first-line treatment course. Second-line treatments (regardless of the hematological and/or extra-hematologi- cal indication) were required in 117 of 151 (77%) patients (Online Supplementary Figure 3A). Patients who did not receive any second-line treatment had shorter median fol- low-up times (10.5 years vs. 12.3 years; P=0.017). The median number of second-line treatments received was two (range, 0–9).
The number of second-line treatments received increased with the time elapsed since first cytopenia with- out reaching a plateau (Online Supplementary Figure 3B). After a sustained CR for both ITP and AIHA achieved, the number of treatments received had continued to increase: at 5 years after CR of both cytopenias, 67% of patients who achieved CR for both ITP and AIHA had received a
new first and/or second-line treatments and 31% had received a new second-line treatment (Online Supplementary Figure S3C).
The number of second-line treatments received increased with age, particularly after the first decade (Figure 4A). At 10 and 20 years, 47% and 88% of patients had received a second-line treatment, respectively (P<0.001). The number of patients receiving ongoing treat- ments also increased with age (Figure 4B). At 10 and 20 years, 27% and 69% of patients had received an active second-line treatment, respectively (P<0.001). At the final follow-up, patients with a cIM had received more second- line treatments (median, 3 vs. 1; P<0.0001).
The most frequently used second-line treatments were rituximab (n=79; 52%), azathioprine (n=55; 36%), splenectomy (n=36; 24%), and mycophenolate (n=29; 19%; Online Supplementary Table S3).
The number of cIM was associated with a subsequent increase in the number of second-line treatments received (HR 1.4; 95% CI: 1.15–1.60; P=0.0002). On the contrary, the number of second-line treatment was not associated to a subsequent increase in the number of cIM in univari- ate analysis (HR 1.09; 95% CI: 0.98–1.22; P=0.11).
Infections
In total, 53 (35%) patients had severe or recurrent infec- tions (Online Supplementary Table S4). The most frequent
462
haematologica | 2022; 107(2)
