
Page 343 - 2022_01-Haematologica-web
P. 343
Letters to the Editor
B
C
A
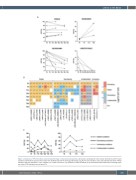
Figure 1. Dynamics of TP53 mutations under ibrutinib therapy in treatment-naïve patients. (A) Each line corresponds to the cancer cell fraction (CCF) of each mutation. Dashed lines represent the median CCF. (B) Heatmap with the CCF log2-fold-change (Log2FC) for each mutation. Color code indicates the trend of TP53 mutation over time: decrease (<-0.5), increase (>1), stable (-0.5 and 1). (C) Dynamics of TP53 mutations in the 2 treatment-naïve cases with co-existing major and minor TP53 mutations at time zero (T0).
haematologica | 2022; 107(1)
335
