
Page 308 - 2022_01-Haematologica-web
P. 308
Letters to the Editor
(Online Supplementary Figure S3). The metabolic conse- quences of rejuvenation (Figure 3B, Online Supplementary Figure S3B) provided additional data-points for establish- ing correlations against t and k (Figure 3C, D). The high- est-ranking metabolic correlates to t, equal to or better than [2,3-DPG], are listed in Figure 3E.
Our findings add O2-unloading kinetics to the other- wise static definition of storage lesion. We provide metabolite correlates to O2 handling beyond 2,3-DPG and ATP for future investigations, and show that RBC SSC, a variable influenced by metabolism and corpuscu- lar morphology, is a useful proxy for O2-exchange kinet-
A
B
C
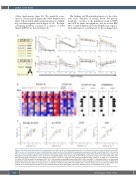
Figure 2. Storage-related dysfunction of O2 handling relates to the level of 2,3- diphosphoglycerate but is best predicted by side-scatter measured on the RET-
RBC-Z channel of hematology analyzers. (A) Biochemical, blood count, and flow-cytometric parameters measured in red cell concentrates (RCC). Color-coding refers to the donor (study #1) and RCC pool (study #2). Parameters include concentration of diphosphoglycerate ([2,3-DPG]), [ATP], blood [Hb], mean corpuscular hemoglobin concentration (MCHC), mean corpuscular hemoglobin (MCH), mean corpuscular volume (MCV), corpuscular forward- and side-scatter (FSC, SSC) after treatment with Cellpack DFL. (B) Summary of parameters (scaled to a range 0-1) determined by single-cell HbO2 saturation imaging (t, k), biochemistry (2,3-DPG, ATP), RET-channel flow cytometry (FSC, SSC), and standard hematologic indices ([Hb], MCHC, MCH, and MCV). Correlations with t or k determined by Spearman test for datasets in study #1 alone, or the combined datasets from both studies. Filled bars indicate significant correlation (P<0.05). (C) Regression analyses determining the ability of storage duration, [2,3-DPG] normalized to [Hb], [ATP] normalized to [Hb], or SSC to predict actual t. Sample-level effects were modeled as a random intercept. Circles and stars indicate data from study #1 and #2, respectively. Goodness-of-fit was quantified by the χ2 test.
300
haematologica | 2022; 107(1)
