
Page 245 - 2022_01-Haematologica-web
P. 245
ASCT for fit, older patients in Myeloma XI
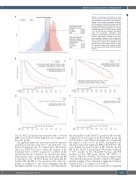
A Figure 2. Outcomes of patients in age- matched groups. (A) Histogram showing the age distribution of patients in the transplant- eligible and transplant-ineligible pathways with the patients included in the age-matched groups highlighted. (B,C) Progression-free sur- vival (B) and overall survival (C) of the age- matched population (TE-ASCT [blue], patients in the TE pathway who underwent autologous stem cell transplant; TE-noASCT [red], patients in the TE pathway who did not under- go ASCT; TNE [yellow], patients in the trans- plant-ineligible pathway. (D,E) Progression- free survival (D) and overall survival (E) com- paring those patients who underwent ASCT with those who did not (ASCT [blue], no ASCT. TE: transplant eligible; TNE: transplant ineligi- ble; HR: hazard ratio; 95%CI: 95% confidence
BC
DE
The TE-ASCT group had most patients with a low-risk MRP score and least with a high-risk score compared to the other groups.
The apparent differences in baseline variables and end- of-induction responses may have confounded the com- parisons between groups. To compensate for this propen- sity score, IPTW was used to adjust the estimate of the treatment effect of ASCT compared to noASCT in the age-matched group of patients. As expected, the adjust- ment had the effect of reducing the median PFS and OS for patients in the TE-ASCT group and increasing the median PFS and OS for the patients in the other two groups as compared to the values emerging from the unweighted intention-to-treat analysis. After adjustment,
the median PFS for the TE-ASCT group was 35.8 months compared to 10.4 months for the TE-noASCT group and 16.9 months for the TNE group (Figure 3A). Comparing the impact of ASCT versus no ASCT, the hazard ratio remained statistically significant (HR=0.44, P<0.001). The same benefit was seen in terms of OS, with the median OS for the TE-ASCT group being 79.8 months compared to 57.3 months for the TE-noASCT group and 59.5 months for the TNE group (Figure 3B) (ASCT vs. noASCT: HR=0.53, P<0.001). This analysis suggests that even when the measured baseline covariates were appro- priately weighted, there remained a significant treatment benefit of ASCT as compared to no ASCT.
Morbidity and mortality were examined by comparing
interval.
haematologica | 2022; 107(1)
237
