
Page 197 - 2022_01-Haematologica-web
P. 197
T-cell-receptor-activity shaped miR-omes of T-PLL
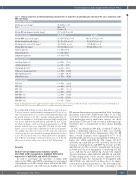
Table 1. Clinical, cytogenetic and immunophenotypic characteristics of analyzed T-cell prolymphocytic leukemia (n=46 cases analyzed by small- RNA sequencing).
Patients‘ characteristics
Median age, years (range)1 Sex
Median OS from diagnosis, months (range)1
Clinical presentation
Median WBC count, x109/L (range)1 Median hemoglobin, g/dL (range)1 Median platelet count, x109/L (range)1 Median LDH, U/L (range)1 Splenomegaly (%)2
Hepatomegaly (%)2 Lymphadenopathy (%)2
Cytogenetic features
inv(14)(q11;q32) (%)2 t(14;14)(q11;q32) (%)2 t(X;14)(q28;q11) (%)2
TCR gene rearrangement3 (%)2 MYC amplification3 (%)2
ATM deletion3 (%)2 Immunophenotype
TCL1 (%)2
CD3+ (%)2
CD5+ (%)2
CD7+ (%)2 CD4+/CD8- (%)2 CD4-/CD8+ (%)2 CD4+/CD8+ (%)2
68 (32-88); n = 46 Male = 25 Female = 21
17.1 (0.4-98.7); n = 44
At diagnosis
91.4 (16.7-825.2); n = 38 12.6 (6.6-16.6); n = 34 129 (33-438); n = 34 567 (178-9423); n = 29 n = 18/29 (62.07)
n = 5/27 (18.52) n = 15/26 (57.69)
At sample
114.1 (20.8-756.2); n = 43 12.6 (6.2-15.6); n = 36 118 (48-394); n = 36 795 (226-8634); n = 36
n = 27/36; n = 3/35; n = 2/36; n = 37/39; n = 23/27; n = 15/33;
n = 35/38; n = 36/40; n = 40/40; n = 39/40; n = 27/39; n = 7/39; n = 5/39;
(75.00) (8.57) (5.56)
(94.87) (85.19) (45.45)
(92.11) (90.00) (100.00) (97.50) (69.23)
(17.95)
(12.82)
1Range reaches from lowest value to highest value in the cohort; 2percentages are out of total cases with sufficient data; 3evaluated by fluorescence in situ hybridization. OS: overall survival; TCR: T-cell receptor; WBC: white blood cell; LDH: serum lactate dehydrogenase.
the resulting miR with the strongest single OS associations (lowest P-values) towards a multi-parameter training model. Next, (iv) we subjected all parameters to a recursive partitioning algorithm using the rpart R package (v.4.1-15) to identify optimum individual cut- offs in our training set. Such deprioritizations finally retained the four factors miR-200a-3p, miR-223-3p, miR-424-5p, and TCL1A, for which optimum cutoffs best allowed discriminations of T-PLL patients with shorter versus longer OS. We then (v) built multi- variate scores for all possible combinations of these four parame- ters, adding one point to the total score if the respective expression cutoff was passed, and calculated optimum thresholds for these scores. We (vi) selected the score which allowed best discrimina- tion of OS in our training set and (vii) verified our score in the val- idation set as well as in the total cohort of 44 T-PLL patients.
Results
Global T-cell prolymphocytic leukemia-specific microRNA (miR) deregulations highlight differential expression of miR-200c and miR-141 clusters
In order to investigate the spectrum of cellular miR expressed in T-PLL, small-RNA sequencing was performed of peripheral blood (PB)-isolated tumor cells from 46 T-PLL patients and of pan-T cells of PB from six healthy donors. T-
PLL patient characteristics are presented in Table 1 and sam- ple purities in the Online Supplementary Figure S1. As T-PLL cases show a spectrum of (often nonconventional) memory T-cell phenotypes and of small naïve subsets,5 we chose age-matched CD3+ pan-T cells as controls (reflecting a rep- resentative mix of populations) in these global profiling analyses.
In total, we identified 2,094 miR, of which 37 miR dis- played a differential expression in T-PLL versus healthy donor T cells (q<0.05, Online Supplementary Table S1). Of these, 14 miR sequences were upregulated (0.7% of all identified miR) and 23 were downregulated in T-PLL (1.1%, Figure 1A). While miR-6724-5p (fold change [fc]=0.18, q<0.0001) and miR-206 (fc=0.04, q<0.0001) showed the strongest downregulation, miR-5699-3p (fc=122, q=0.02), miR-200c-3p (fc=38.2, q=0.005), and miR-141-3p (fc=43.2, q=0.005) were the most upregulated. Considering all T-PLL cases, miR-141-3p and miR-21-5p showed the highest absolute abundance while miR-206, miR-651-3p and miR- 6774-5p displayed the lowest absolute expression (Online Supplementary Figure S2). Among the 37 deregulated miR, miR-6724-5p was annotated four times due to its expres- sion from four different genomic loci. The following analy- ses are, therefore, based on 34 miR, containing a sum
haematologica | 2022; 107(1)
189
