
Page 165 - 2022_01-Haematologica-web
P. 165
Nupr1 regulates the quiescence threshold of HSC
AB
C
DE
FG
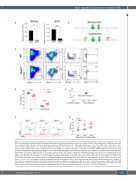
Figure 1. Loss of Nupr1 activates hematopoietic stem cells that are dormant during homeostasis. (A) Expression pattern of Nupr1 in hematopoietic stem cells (HSC) and multipotent progenitors (MPP) examined by RNA-sequencing and real-time polymerase chain reaction (qPCR). One thousand HSC or MPP from bone mar- row of wild-type (WT) mice were sorted as individual samples for RNA-sequencing (n=4). HSC were defined as Lin– (i.e., CD2–, CD3–, CD4–, CD8–, Mac1–, Gr1–, Ter119–, B220–), CD48–, Sca1+, c-kit+, and CD150+. MPP were defined as Lin–, Sca1+, c-kit+, and CD150–. Data were analyzed using an unpaired Student t-test (two- tailed) and are represented as mean ± standard deviation (SD) (qPCR, n=3 mice for each group). **P<0.01, ***P<0.001. FPKM: fragments per kilobase of exon per million mapped reads. (B) Targeting strategy for the knockout of the Nupr1 gene in mice. WT Nupr1 exons 1 and 2 are shown as green boxes. Two loxp elements flanking exon 1 and exon 2 were inserted. (C) Cell cycle analysis of Nupr1-/- HSC under homeostasis. Representative plots of cell cycle from representative WT and Nupr1-/- mice (8 weeks old). WT littermates (8 weeks old) were used as controls. HSC (Lin– CD48– Sca1+ c-kit+ CD150+ CD34– CD135–) were analyzed by DNA content (DAPI) versus Ki-67: G0 (Ki-67lowDAPI2N), G1 (Ki-67highDAPI2N), G2-S-M (Ki-67highDAPI>2N-4N). (D) Statistical analysis of the HSC cycle. The percentages (%) of HSC in G0 and in G1-G2-S-M stages were analyzed. Data were analyzed using an unpaired Student t-test (two-tailed) and are represented as mean ± SD (n=6 mice for each group). **P<0.01. (E) The strategy of the BrdU incorporation assay. The 8-week-old Nupr1-/- mice and littermates were injected intraperitoneally with 1 mg BrdU on day 0. The mice were then allowed to drink BrdU (0.8 mg/mL) water ad libitum until analyzed on days 3, 4, and 5. (F) Dynamic analysis of BrdU+ HSC after BrdU administration, as determined by flow cytometry on days 3, 4, and 5. (G) Kinetics of the BrdU+ HSC ratio. Data were analyzed using an unpaired Student t-test (two- tailed) and two-way analysis of variance and are represented as mean ± SD (n=4 mice for each group). *P<0.05, **P<0.01, ***P<0.001.
haematologica | 2022; 107(1)
157
