
Page 158 - 2022_01-Haematologica-web
P. 158
S.J. Erkeland et al.
ABC
D
E
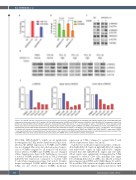
Figure 4. The TGFbR pathway is deregulated in T-cell prolymphocytic leukemia. (A) Overexpression of miR-200c and miR-141 relative to U6 in HeLa-Mir-200c/141 compared to HeLa-empty vector (EV) is plotted. (B) The mRNA expression of ZEB2 and TGFbR3 relative to GAPDH in HeLa-Mir-200c/141 compared to HeLa-EV is plotted. (C) HeLa-Mir-200c/141 and HeLa-EV cells were treated with hu-TGFb1 (10 ng/mL, +) or not stimulated (0 ng/mL, - hu-TGFb1) for 1 hour. Samples of cell lysates were taken and analyzed by western blotting using phospho-specific antibodies against SMAD2 and SMAD3, total SMAD2/3, b-actin and TGFβR1. Data are representative of three independent experiments. (D) Cells were stimulated with hu-TGFb1 (+ hu-TGFb1) or not stimulated (0 ng/mL, - hu-TGFβ1) for 1 hour. Samples of indicated cell lysates were analyzed by western blotting with phospho-specific antibodies against SMAD2 and SMAD3, total SMAD (SMAD2 = upper band, SMAD3 = lower band) and β-actin. (E) Quantification of the data shown in (D). Induction of hu-TGFb1-mediated phosphorylation of indicated phospo-proteins relative to the total SMAD expression level and peripheral blood mononuclear cells (PBMC) values of the different samples are depicted.
(FC=0.046; FDR=9.66x10⁻¹⁹), which are all significantly downregulated in T-PLL (Online Supplementary Figure S3A), whereas the mRNA expression of TGFbR1 and TGFbR2 was not changed. Our array data showed reduced expres- sion of TGFbR3 compared to all normal T-cell fractions tested, whereas TGFβR1 and TGFbR2 was not changed (Online Supplementary Figure S3B). Furthermore, we noted a reduced TGFbR3 membrane levels in T-PLL with high miR-200c/141 expression compared to normal CD4 T cells (Online Supplementary Figure S3C and D). Notably, despite unchanged TGFbR1 mRNA and protein levels in T-PLL, we did observe reduced TGFbR1 membrane
expression on T-PLL compared to normal CD4 T cells (Online Supplementary Figure S3C and E).
A global test on the gene expression profiles of the pre- dicted miR-200c/141 targets in high miR-200c/141 samples and miR-181a/b targets in high miR-181a/b samples revealed that 220 miR-200c/141 targets and 115 miR- 181a/b targets were significantly downregulated in T-PLL compared to effector CD4 cells, including Zinc finger E box-binding homeobox 2 (ZEB2, also known as Smad- interacting protein 1 [SIP1]) and TGFbR3 (Figure 3C and D). We noted that ZEB2 expression is highly variable in normal T-cell fractions with the highest expression in effector CD8
150
haematologica | 2022; 107(1)
