
Page 90 - 2021_12-Haematologica-web
P. 90
E. W. Petersdorf et al.
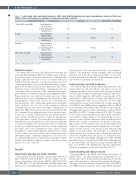
Table 2 Leader match status and clinical Outcome in 1,013 single HLA-B-mismatched cord blood transplantations (matched at HLA-A and -DRB1). A total of 814 patients are evaluable for relapse and non-relapse mortality.
Clinical Endpoint
Grades II-IV acute GvHD
Relapse
Mortality
Non-relapse mortality
Group*
Leader-matched (220/604=36%) Leader mismatched (138/384=36%)
Leader-matched (132/498=27%) Leader-mismatched (92/316=29%)
Leader-matched (332/620=54%) Leader-mismatched (182/393=46%)
Leader-matched (168/498=34%) Leader-mismatched (79/316=25%)
Odds Ratio or Hazard Ratio
1 0.98
1 1.02
1 0.85
1 0.72
95% Confidence Interval P - -
0.75-1.29 0.89
- -
0.77-1.35 0.87
- -
0.71-1.02 0.08
- -a 0.55-0.94 0.02
*The numbers refer to the number of patients who developed the clinical endpoint out of the total number of evaluable patients (for whom data for the clinical endpoint was available). GvHD: graft-versus-host disease.
Statistical analysis
We examined the association of the HLA-B leader genotype and leader matching with grades II-IV acute GvHD, relapse, death not preceded by relapse, disease-free survival and overall mortality. Logistic regression was used to assess associations with acute GvHD. For all other endpoints, Cox regression models were fit to compare the hazards or cause-specific hazards of failure, as appro- priate, between HLA-B leader groups, and patients who did not fail by last contact or who failed from a competing risk were cen- sored at last contact or at the time of the competing risk (as appro- priate). Relapse was studied for patients with malignant disorders. Regression models were adjusted for patient age, year of trans- plantation, disease risk at transplantation (low, intermediate, high, non-malignant), total nucleated cell dose, use of anti-thymocyte globulin, intensity of the conditioning regimen (reduced-intensity versus ablative), use of total body irradiation, patient cytomegalovirus serologic status, and number of mismatches at HLA-A and -DRB1. Various interactions, as detailed in the Results, were examined by including appropriate factors in these regres- sion models. Covariates with missing data were included in mod- els by creating an additional category to reflect the missing value of the appropriate covariate. If outcome data were missing for a particular patient, such a patient was excluded from the appropri- ate regression analysis. Two-sided P-values from Cox regression models were obtained from the Wald test. Several comparisons were made, all focused on refinements of the concept of leader matching versus leader mismatching. No adjustments were made to the P-values associated with the fitted regression models, although the impact of multiple comparisons is reduced because the examined endpoints are correlated with one another. For indi- vidual models with more than two categories, global tests of sig- nificance were also conducted.
Results
HLA-B leader genotype and leader matching
The frequency of leader genotypes among patients (293 [6%] MM; ,1724 [36%] MT; 2,805 [58%] TT) were similar to the fre- quencies among the cord blood units (295 [6%] MM; 1828 [38%] MT; 2699 [56%] TT) and HLA-matched and HLA-mismatched unrelated donor transplants (Figure 1).19,20 Among the entire study
population, 81% were leader-matched and 19% were leader-mis- matched. The distribution among transplants with one HLA-B mismatch was 1,027 (47%) leader-matched/share T, 311 (14%) leader-matched/share M, 640 (29%) leader-mismatched/share T, and 200 (9%) leader-mismatched/share M.
Leader genotype and clinical outcome
We tested the hypothesis that the HLA-B leader genotype of the patient and/or the unit may influence the clinical outcome by examining the impact of the patient’s leader genotype separately from the cord blood unit’s leader genotype among the entire popu- lation of 4,822 transplants. Although the leader genotype of the patient did not exhibit obvious correlation with clinical outcome (Online Supplementary Tables S2, S3 and S4), the cord blood unit’s leader genotype was associated with the risk of relapse among the 1,013 HLA-A and -DRB1-matched transplants with one HLA-B allele mismatch (Online Supplementary Table S4). In this subgroup, transplantation from MT cord blood units had an estimated hazard ratio (HR) of 1.29 (95% Confidence Interval [CI]: 0.96-1.73) relative to TT cord blood units and MM had an estimated HR of 1.69 (95% CI: 1.03-2.75) for relapse relative to TT. The probability of observ- ing these or more extreme differences under the null hypothesis that the risks of relapse are identical across the three leader geno- type groups is 0.06. In addition, if one models the number of M leaders as a continuous linear variable ranging from 0 to 2 (address- ing the possible existence of an increase in risk with increasing number of M leader alleles), the probability of a difference in relapse risk that is as extreme or more extreme than what was observed is 0.02 (HR 1.30 for each increase of one M leader allele, 95% CI: 1.05-1.60). Interestingly, transplantation of MT and MM units did not show a clear impact on GvHD risk but MM units may be associated with a lower risk of non-relapse mortality (HR 0.46, 95% CI: 0.23-0.95; Online Supplementary Table S4), although the global test of significance of the unit leader yielded P=0.11.
Leader matching and clinical outcome
The dimorphism of the HLA-B leader defines two lineages of HLA-B alleles.19 In HLA-B-mismatched transplantation, the patient’s and cord blood unit’s mismatched alleles may be from the same (leader-matched) or different (leader-mismatched) lineage. The impact of leader matching was examined in the 1,013 HLA-A and -DRB1-matched transplants with a single HLA-B mismatch.
3110
haematologica | 2021; 106(12)
