
Page 192 - 2021_12-Haematologica-web
P. 192
Letters to the Editor
respectively, in the Mel200 group. The median PFS and OS in the Mel140 group were 36.6 (95% CI: 26.3-43.7) and 83.0 (95% CI: 55.3-not reached) months, respective- ly, compared to 40.6 (95% CI: 37.0-45.1) and 92.0 (95% CI: 86.2-101.7) months, respectively, in the Mel200 group. Before adjusting for the known risk factors, Mel200 was associated with comparable PFS (hazard ratio [HR]: 0.81, 95% CI: 0.63-1.05; P=0.12), but improved OS (HR: 0.62, 95% CI: 0.44-0.87; P=0.005). After adjusting for age at ASCT, ISS, KPS, serum creati- nine, disease status at ASCT, HCT-CI, and induction treatment, there were no statistically significant differ- ences in PFS (HR 0.91, 95% CI: 0.66-1.26; P=0.58) or OS (HR: 0.79, 95% CI: 0.52-1.19; P=0.26) between the Mel140 (reference) and Mel200 groups (Figure 1).
The 1:3 matching produced a dataset of 304 patients, 76 in the Mel140 group and 228 in the Mel200 group. The response rates at 3 months after ASCT were similar to the estimates before matching (Mel140: 96%; Mel200: 96%). The CR/sCR, VGPR, and PR rates were 24%, 53%, and 20%, respectively, in the Mel140 group, compared to 30%, 49%, and 18%, respectively, in the Mel200 group. At a median follow-up of 51.8 (range: 0.3-105.1) months, the median PFS and OS for all matched patients were 38.3 (95% CI: 33.5-43.5) and 82.2 (95% CI: 73.0-97.9) months, respectively. Using fitted conditional regression models, the overall PFS (HR: 0.90, 95% CI: 0.63-1.29; P=0.56) and OS (HR: 0.72, 95% CI: 0.46-1.13; P=0.15) were not significantly different between the two melpha- lan groups. Likewise, there were no significant differ-
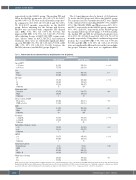
Table 1. Patient and disease characteristics by melphalan dose for all patients. Melphalan Dose
Measure, n (%)
Age at ASCT < 65 years ≥ 65 years
Sex Male
Female
ISS stage I
II
III Unknown
Cytogenetic risk* Standard
High
Unknown
Disease status at ASCT PR or worse
VGPR or better
LDH Normal High Unknown
Creatinine < 2 mg/dL ≥ 2 mg/dL Unknown
Karnofsky performance status <90
≥90 Unknown
HCT-CI ≤3 >3
Unknown
Induction treatment Conventional IMiD
PI
IMiD + PI
Maintenance therapy No
Yes
140 mg (N=97)
20 (21) 77 (79)
56 (58) 41 (42)
15 (19) 34 (43) 31 (39) 17
67 (74) 24 (26) 6
47 (48) 50 (52)
50 (85) 9 (15) 38
61 (68) 29 (32) 7
38 (40) 58 (60) 1
53 (55) 43 (45) 1
1 (1) 11 (11) 47 (48) 38 (39)
24 (25)
73 (75)
200 mg (N=814)
562 (69) 252 (31)
465 (57) 349 (43)
299 (44) 197 (29) 182 (27) 136
599 (77) 176 (23) 39
411 (50) 403 (50)
459 (88) 61 (12) 294
653 (85) 116 (15) 45
180 (23) 597 (77) 37
645 (81) 156 (19) 13
19 (2)
73 (9) 272 (33) 450 (55)
183 (22)
631 (78)
P
< 0.001 1.00
< 0.001
0.43
0.75 0.40
< 0.001
0.001
< 0.001
0.012
0.61
ASCT: autologous stem cell transplantation; HCT-CI: hematopoietic cell transplantation-specific comorbidity index; IMiD: immunomodulatory imide drug; ISS: International Staging System; LDH: lactate dehydrogenase; PR: partial response; PI: proteasome inhibitor; VGPR: very good partial response. *High-risk cytogenetic category was defined as patients with any of the following genetic abnormalities at diagnosis: 17p deletion, t(4;14), t(14;16), 1q gain, and del13 (only if by cytogenetics).
3212
haematologica | 2021; 106(12)
