
Page 188 - 2021_12-Haematologica-web
P. 188
Letters to the Editor
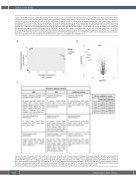
Figure 1. Bulk RNA sequencing of WT-SRC and E527K-SRC megakaryocytes. (A) A total of three hematopoietic stem cell (HSC) pools were isolated from periph- eral blood from 15 healthy controls and cultured in HSC amplification medium (with cytokine cocktail 100). On day 1 after isolation, HSC were transduced in triplicate with either wild-type SRC (WT-SRC) or E527K-SRC lentiviral vectors. On day 2, differentiation to megakaryocytes (MK) was initiated upon addition of the cytokines TPO, SCF and IL1b. Day 12 mature MK were collected for bulk RNA sequencing and shotgun proteomics. (B) Flow cytometry of day 12 MK stained for CD41 (forward scatter) and CD42 (side scatter). The % of CD41+ and CD41/CD42+ MK are shown for WT-SRC and E527K-SRC cells as mean and standard deviation for 3 cultures. (C) Principal component analysis of 6 WT-SRC and 6 E527K-SRC MK samples used for RNA sequencing. (D) Heatmap visualizing the 852 differentially expressed genes (DEG) identified in E527K-SRC vs. WT-SRC MK samples (red, upregulated genes; blue, downregulated genes). (E) Volcano plot showing the 852 DEG detected in E527K-SRC MK organized according to log2(fold-change [FC]) and -log10(false discovery rate [FDR]). (red, upregulated genes with FDR<0.05 and log2FC>1; blue, downregulated genes with FDR<0.05 and log2FC<-1). (F) The 852 DEG were used for Reactome pathway analysis. Top 5 downregulated (blue) and upregulated (red) pathways are shown as arranged by their -log(FDR) value.
Figure 2. Shotgun Proteomics of WT-SRC and E527K-SRC megakaryocytes. (A) Principal component analysis of three wild-type SRC (WT-SRC) and three E527K- SRC megakaryocyte (MK) samples used for shotgun proteomics analysis. (B) Volcano plot showing the 141 differentially expressed proteins (DEP) detected in E527K-SRC MK organized according to log2(fold-change [FC]) and -log10(false discovery rate [FDR]). (red, upregulated proteins with FDR<0.01 and log2FC>1; blue, downregulated proteins with FDR<0.01 and log2FC<-1) (C) Top 3 enriched downregulated pathways in E527K-SRC MK from Reactome analyses using dif- ferentially expressed genes (DEG), DEP and the combined dataset (left panel). Genes selected for validation are depicted in blue. FDR values for these five most significant interferon-stimulated genes (ISG) are shown as found in the RNA sequencing and proteomics analyses (right panel).
AB
C
3208
haematologica | 2021; 106(12)
