
Page 172 - 2021_12-Haematologica-web
P. 172
A.M. Risitano et al.
tently low irrespective of subtherapeutic plasma danico- pan levels in predose periods (Figure 1B, middle panel). A strong positive correlation was found between Bb and LDH (Pearson r=0.80, P<0.0001) (Online Supplementary Figure S2E), supporting Bb as a reliable biomarker of in vivo AP activation in PNH and, therefore, its value for monitor- ing efficacy. Danicopan also showed strong linear correla- tions with Bb and LDH (negative), as did AP with Bb and LDH (positive); there was no correlation of classical path- way activity with any of these parameters (Online Supplementary Table S5), validating the role of danicopan in AP inhibition and subsequent in vivo changes of Bb and LDH. Additional laboratory results can be found in Online Supplementary Table S6.
There was a slight increase in serum C3 (114.2±17.3 mg/dL at day 84 vs. 102.2±20.2 mg/dL at baseline, P=0.08) (Online Supplementary Figure S2C), likely from reduced C3 consumption because of upstream complement blockade. Importantly, C3 fragment deposition on erythrocytes was
very low (<0.5% of erythrocytes) throughout treatment (Figure 4A).
sC5b-9 was normal at baseline and remained relatively constant over time (data not shown).
Discussion
Current PNH treatments target C5 inhibition.10-14 Novel complement inhibitors in development aim to address unmet needs of PNH patients.22 Here, we describe a novel approach to PNH treatment, which aims to change the current paradigm of PNH therapy by improving hemoglo- bin levels in addition to reducing hemolysis, with the added advantage and convenience of oral administration. We investigated danicopan, a first-in-class oral factor D inhibitor, which blocks the proximal complement cascade upstream of C5 at the level of AP initiation and amplifica- tion. In untreated PNH patients, danicopan monotherapy resulted in inhibition of intravascular hemolysis, with sig-
AB
C
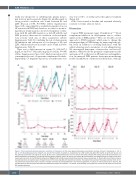
Figure 1. Pharmacokinetic-pharmacodynamic evaluation of danicopan. (A) The mean plasma danicopan concentration by dose at hours 0 (predosing), 1, 1.5, 2, 2.5, 3, 4, 6, 8 (predosing) and 12 of days 6, 13, and 20. The number of patients is, respectively, two (100 mg tid) and eight (150 mg tid) at day 6 and day 13, and five (150 mg tid) and five (175 mg tid) at day 20. (B) The mean ± standard deviation of ex vivo serum alternative pathway (AP) activity, plasma Bb concentration, and plasma danicopan concentration, combining all dosing groups together. Serum AP activity and plasma Bb concentration were determined for a subset of the afore- mentioned time points by the AP Wieslab assay (Euro Diagnostica) and Bb enzyme-linked immunosorbent assay, respectively. (C) Plasma Bb concentration (mean ± standard deviation) at baseline (day 1) through the end of the study (day 84) with descriptive statistics. The dashed lines represent the upper and lower limits of nor- mal, which were derived from phase I studies in healthy volunteers (see Assay Methods in the Online Supplement). N values of <10 for plasma Bb on days 42, 56, and 84 reflect the two early discontinuations and additional samples not collected. **P<0.005. tid: thrice daily; ULN: upper limit of normal; LLN: lower limit of normal; SD: standard deviation.
3192
haematologica | 2021; 106(12)
