
Page 134 - 2021_12-Haematologica-web
P. 134
M. Nairz et al.
contrasting infection outcomes suggested dominant effects of Hfe in myeloid cells. In order to identify the responsible mechanisms, we monitored gene response patterns of iron and immune genes in spleens and livers of S. Tm.-infected mice.
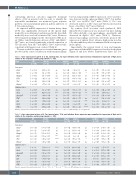
As expected, mRNA expression of ferritin heavy chain (H-Ft) was significantly decreased in the spleen (hall- marked by iron deficiency) and increased in the liver (hall- marked by iron overload) of infected Hfe-/- mice. However, H-Ft remained unchanged in the other infected Hfe-mod- els (Tables 1 and 2). Likewise, in livers of Hfe-/- and AlfpCre+ Hfefl/fl mice, we found significantly reduced expression of Tfr1 (2x and 1.3x in Hfe-/- and AlfpCre+ Hfefl/fl, respectively), consistent with hepatic iron overload (Table 2).
We next studied the expression of central immune genes involved in the control of infection with intramacrophage
bacteria. Importantly, mRNA expression of Il-6 and Ifn-g was decreased in the spleen in AlfpCre+ Hfefl/fl, but neither in Hfe-/- nor LysMCre+ Hfefl/fl mice (Table 1). Il-10 was decreased in livers of Hfe-/- mice and Tnf was increased in livers of LysMCre+ Hfefl/fl mice (Table 2).
By contrast, Nos2 (for nitric oxide synthase-2, AKA inducible Nos) expression was increased in mice lacking Hfe either globally or in macrophages, specifically, and decreased in AlfpCre+ Hfefl/fl mice (Table 1). Therefore, reduced macrophage iron levels selectively promote the expression of splenic Nos2, whereas high serum iron has a broader inhibitory effect on antimicrobial host responses in the spleen.
Importantly, the protein levels of iron and immune genes mirrored the mRNA expression levels in both spleen (Figure 5) and liver (Online Supplementary Figure S4). For
Table 1. Gene expression in spleen of S. Tm. injected mice, 72 h post infection. Gene expression was normalized to expression of Hprt and is relative to the respective control group (means +/- SD).
Gene WT Hfe-KO P (n=10) (n=12)
AlfpCre– AlfpCre+ (n=20) (n=14)
P LysMCre– LysMCre+ P
(n=15) (n=15)
Iron genes
Dmt1 1 +/- 1.06 Fpn1 1 +/- 0.38 Hamp1 1 +/- 1.11 H-Ft 1 +/- 0.22 Tfr1 1 +/- 0.43 Hmox1 1 +/- 0.68
Immune genes
Lcn2 1 +/- 1.69 Nos2 1 +/- 1.06 phox-p47 1 +/- 0.96 TNF 1 +/- 0.66 IL-6 1 +/- 0.73 IL-10 1 +/- 0.81
2.85 +/- 3.1 ns 1.2 +/- 0.88 ns 1.4 +/- 1.58 ns 0.41 +/- 0.2 **** 1.23 +/- 1.41 ns 0.77 +/- 0.61 ns
1.1 +/- 0.89 ns 4.23 +/- 2.09 *** 0.88 +/- 0.49 ns 1.29 +/- 2.29 ns 0.74 +/- 1.04 ns 2.35 +/- 2.93 ns
1 +/- 0.42 1 +/- 0.26 1 +/- 1.02 1 +/- 0.72 1 +/- 0.57 1 +/- 0.67
1 +/- 1.72 1 +/- 0.81 1 +/- 0.55 1 +/- 0.62 1 +/- 0.31 1 +/- 1.12 1 +/- 0.28
Table 2. Gene expression in livers of S. Tm. injected mice, 72 h post infection. Gene expression was normalized to expression of Hprt and is relative to the respective control group (means +/- SD).
0.98 +/- 0.5 1.28 +/- 0.44 1.12 +/- 1.15 0.63 +/- 0.32 1.55 +/- 1.05 0.9 +/- 0.37
0.61 +/- 0.61 0.37 +/- 0.23 0.61 +/- 0.25 0.82 +/- 0.71 0.6 +/- 0.36 0.9 +/- 0.75 0.45 +/- 0.29
ns 1 +/- 0.55 * 1 +/- 0.46 ns 1 +/- 0.95 ns 1 +/- 0.68 ns 1 +/- 0.84 ns 1 +/- 0.65
ns 1 +/- 0.72 ** 1 +/- 0.83 * 1 +/- 0.31 ns 1 +/- 0.5 *** 1 +/- 0.66 ns 1 +/- 0.79 **** 1 +/- 0.72
0.73 +/- 0.33 ns 0.87 +/- 0.49 ns 1.14 +/- 0.58 ns 0.9 +/- 0.62 ns 1.16 +/- 0.87 ns 0.79 +/- 0.53 ns
1.43 +/- 0.85 ns 1.87 +/- 1.2 * 1.14 +/- 0.33 ns 1.02 +/- 0.38 ns 1.02 +/- 0.5 ns 1.2 +/- 0.63 ns 1.17 +/- 0.66 ns
IFN-g 1 +/- 0.71
Statistics: unpaired, two-sided student t-test; *P<0.05; **P<0.01; ***P<0.005; ****P<0.0001; WT: wild-type; ns: not significant.
Gene WT Hfe-KO P (n=10) (n=12)
AlfpCre–
(n=20)
1 +/- 0.42 1 +/- 0.2 1 +/- 0.46 1 +/- 0.26 1 +/- 0.26 1 +/- 0.37
1 +/- 1.96 1 +/- 0.86 1 +/- 0.55 1 +/- 0.72 1 +/- 0.56 1 +/- 1.05 1+/-0.47
AlfpCre+
(n=14)
0.98 +/- 0.68 1.61 +/- 0.63 0.91 +/- 0.46 1 +/- 0.33 0.75 +/- 0.36 1.32 +/- 0.79
2.36 +/- 3.81 0.96 +/- 1.04 0.99 +/- 0.47 1.14 +/- 1.23 0.99 +/- 0.86 1.47 +/- 1.36 0.98+/-0.69
P LysMCre– LysMCre+ P
(n=15) (n=15)
2.74 +/- 3.18 ns
Iron genes
Dmt1 1 +/- 0.24 Fpn1 1 +/- 0.21 Hamp1 1 +/- 0.59 H-Ft 1 +/- 0.24 Tfr1 1 +/- 0.23 Hmox1 1 +/- 0.29
Immune genes
Lcn2 1 +/- 0.9 Nos2 1 +/- 1.34 phox-p47 1 +/- 0.56 TNF 1 +/- 1.02 IL-6 1 +/- 0.17 IL-10 1 +/- 0.15
1.06 +/- 0.64 ns 1.08 +/- 0.47 ns 1.51 +/- 1.05 ns 1.59 +/- 0.35 *** 0.49 +/- 0.19 **** 0.88 +/- 0.44 ns
11.8 +/- 6.3 **** 1.38 +/- 2.4 ns 1.19 +/- 0.79 ns 1.33 +/- 1.5 ns 0.94 +/- 0.27 ns
0.83 +/- 0.17 *
ns 1 +/- 0.57 *** 1 +/- 0.38 ns 1 +/- 0.45 ns 1 +/- 0.37 * 1 +/- 0.49 ns 1 +/- 0.49
ns 1 +/- 2.32 ns 1 +/- 1.06 ns 1 +/- 0.66 ns 1 +/- 0.51 ns 1 +/- 1.1 ns 1 +/- 0.85
1.08 +/- 0.68 ns 1.08 +/- 0.34 ns 1.01 +/- 0.36 ns 0.83 +/- 0.37 ns 0.77 +/- 0.46 ns 0.99 +/- 0.46 ns
1.15 +/- 1.7 ns 1.17 +/- 1.25 ns 1.05 +/- 0.62 ns 1.65 +/- 0.93 * 1.11 +/- 1.02 ns 0.76 +/- 0.75 ns 0.97+/-0.57 ns
IFNg 1+/-0.24
Statistics: unpaired, two-sided student t-test; *P<0.05; **P< 0.01; ***P< 0.005; ****P<0.0001; WT: wild-type; ns: not significant.
1.12+/-0.25 ns
ns 1+/-0.49
3154
haematologica | 2021; 106(12)
