
Page 113 - 2021_12-Haematologica-web
P. 113
SF3B1 mutations and NOTCH1 activation in CLL
A
BC
D
E
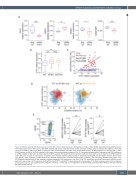
Figure 5. NOTCH1 signaling and DVL2 silencing correlate with reduced CD20 expression. (A) Expression of DVL2, HES1, MS4A1 determined by quantitative reverse transcriptase polymerase chain reaction (RT-qPCR) analysis and surface CD20 determined by flow cytometry in MEC1 cells, transfected with negative control (Neg ctrl, n=5) or siRNA for DVL2 (n=5). Data are shown by Tukey box and whisker plots. MFI: mean fluorescence intensity. (B) DTX1 expression in wild-type (WT; n=155), SF3B1-mutated (n=35) or NOTCH1-mutated (n=32) cases of chronic lymphocytic leukemia (CLL). (C) Correlation between altDVL2 expression and DTX1 expression in SF3B1-mutated (n=35) cases, as determined by RT-qPCR analysis. The Spearman rank correlation coefficient (rho) and P-value are reported for SF3B1-mutated cases. WT cases (n=115) are reported for comparison. (D) Correlation between DTX1 expression determined by RT-qPCR and the CD20dim fraction. Density plots (log10 density) show clustering of SF3B1-mutated and NOTCH1-mutated cases as double positive DTX1high/%CD20dim (see also Online Supplementary Figure S7A). (E) Left panel: representative dot plot showing the gating strategy for CD20 expression in the CD19+/CD5+ CLL population; right panel: evaluation of altDVL2 by next- generation sequencing or DTX1 expression by RT-qPCR in the CD20high and CD20low subpopulations of sorted samples (n=9). Data are shown as dot-and-line diagrams of the fold increase over the CD20high fraction. *P≤0.05, **P≤0.01, ***P≤0.001, n.s. not significant, as determined by a two-sided Mann-Whitney rank-test or paired Wilcoxon signed-rank test.
haematologica | 2021; 106(12)
3133
