
Page 227 - 2021_10-Haematologica-web
P. 227
Letters to the Editor
AB
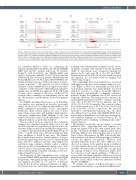
Figure 1. Prognostic impact of gain and amplification of 1q21 in multiple myeloma. Forest plot of a meta-analysis for (A) progression-free survival and (B) overall survival for gain(1q) (orange) and amp(1q) (red), validating the prognostic impact of both lesions in the independent GMMG HD4 and MM5 and the NCRI Myeloma XI trials. Column “n” shows the number of patients with gain(1q) or amp(1q) per trial. The total number of patients included per trial is shown in brackets in the column “study”. Circles show hazard ratio (HR) point estimates and lines indicate the 95% confidence intervals (95% CI). Diamonds depict summary hazard ratios computed under a random-effects model, with 95% confidence intervals given by their width. Unbroken vertical lines represent the null value (HR = 1.0).
for validation purposes (Table 1), comprising the German-speaking Myeloma Multicenter Group (GMMG) HD4 trial (n=341, median follow-up 93 months; EudraCT 2004-000944-26), the GMMG MM5 trial (n=539, 58 months; EudraCT 2010-019173-16) and the UK National Cancer Research Institute (NCRI) Myeloma XI trial (MyXI, n=1,716, 65 months; NCT01554852); the designs and main outcomes of these trials have been pre- viously reported.9-11 All patients provided written informed consent. GMMG trials were approved by ethics committees of the University of Heidelberg and all partic- ipating sites, and MyXI was approved by the UK South Central ethics committee (reference 09/H0604/79), research ethics committees at participating centers and the UK Medicines and Healthcare Products Regulatory Agency.
For GMMG, interphase fluorescence in situ hybridiza- tion analysis was performed as described previously, with a cut-off of 10% for calling 1q abnormalities.12 For MyXI, multiplexed quantitative reverse transcriptase polymerase chain reaction analysis was used to deter- mine translocation status, and multiplex ligation-depen- dent probe amplification (MRC Holland) to call copy number aberrations, with a cut-off equivalent to 20% for calling aberrations, as previously described.2
The association between categorical and continuous variables was examined using the Fisher exact test and the Wilcoxon rank test, respectively. Progression-free sur- vival was defined as time from enrollment to progression, according to International Myeloma Working Group cri- teria,13 or death of any cause. Overall survival was time from enrollment to death of any cause. The Kaplan- Meier method was used for survival analyses. Cox pro- portional hazards regression was used to estimate hazard ratios and 95% confidence intervals. Meta-analysis was performed using summary statistics under a random effect model. The Cochran Q and I2 statistics were calcu- lated to test for heterogeneity, with I2 ≥75% being con- sidered substantial heterogeneity. All analyses were per- formed using R version 3.6.3.
The frequencies of 1q21 abnormalities were consistent between GMMG (HD4 and MM5 combined) and MyXI trial patients, with gain(1q) being seen in 28% and 27%, and amp(1q) detectable in 9% and 7% of patients, respectively. Laboratory parameters indicative of aggres- sive disease were associated with both gain and amp(1q),
including reduced hemoglobin and platelet levels, elevat- ed plasma creatinine and stage III of the ISS and R-ISS (Table 1). Associations were stronger for amp(1q) for platelet levels, and stage III of the ISS and R-ISS. Translocations t(4;14) and t(14;16) were enriched in gain and amp(1q), the association between amp(1q) and t(4;14) being stronger.
Not surprisingly, given that amp(1q) was associated with aggressive disease, it had a negative impact on out- come (Figure 1). However, individually per trial and by meta-analysis gain(1q) was independently associated with poor outcome, too, with no discernible difference from amp(1q) and markedly overlapping confidence intervals, despite the significant size of the cohorts and long-term follow-up. For progression-free survival, the meta-analysis hazard ratios and 95% confidence intervals were 1.50 (1.16-1.95), P=0.002 for gain(1q), and 1.65 (1.25-2.19), P<0.001 for amp(1q). The respective values for overall survival were 1.85 (1.43-2.39), P<0.001 and 2.28 (1.42-3.64), P<0.001, respectively. We observed moderate to substantial heterogeneity, since the effect sizes differed between trials, with GMMG-MM5 show- ing the highest hazard ratios for both gain and amp(1q), yet consistent similarity in outcomes between the 1q copy number states, validating our finding in three inde- pendent datasets.
Our findings on gain(1q) are in contrast to recently published data suggesting that only amp(1q) is a prognostic marker, but in line with reports from other groups.4-6 Technical variability in calling 1q status and, in particular, differences in follow-up time may account for some of these discrepancies: for HD4, a previously pub- lished analysis with shorter follow-up suggested inferior outcome for amp(1q) over gain(1q).12 However, with extended follow-up shown here these differences lev- elled out as relapses in the gain(1q) group accumulated over time. Similar effects were observed for shorter versus extended observation time in MyXI. This is in line with the ongoing evolution of 1q aberrations, which have been shown to be of clinical significance.3,14 Of note, a recent study describing significant differences between amp(1q) and gain(1q) only had a median follow-up of less than 2 years, which is short for exploratory survival analyses in NDMM.6
To examine the impact of different therapies on 1q copy number aberrations, we performed landmark analy-
haematologica | 2021; 106(10)
2755
