
Page 215 - 2021_10-Haematologica-web
P. 215
Letters to the Editor
ABC
F
G
DE
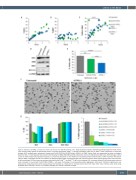
Figure 3. Efficiency of ATM1.1 construct in sickle cell disease and b0/b0 patients’ cells. Dose/response analyses obtained by plotting integration levels (vector copy number [VCN]) against the percentage values of (A) adult hemoglobin (HbAT87Q), (B) fetal hemoglobin (HbF) and (C) HbAT87Q+HbF, respectively, in sickle cell disease (SCD) erythroid cells untreated or treated with ALS10-T87Q, ALS10-T87Q-silent, ATM1.1, or ATM1.1-silent. Data are represented as mean ± standard deviation (SD), n=3. (D) Representative western blot showing the HBA, HBB, HBG and BCL11A protein content in differentiated SCD cells. (E) Percentage of blind counts of sickle-shaped cells exposed to hypoxia, as previously described,5 in four fields from untransduced SCD erythroid cells or after treatment with ALS10- T87Q or ATM1.1. Averages and SD are indicated. (F) Representative image of patient-derived SCD erythroid cultures under hypoxia. Arrows mark cells with sick- le-like morphology. (G) Dose/response analyses obtained for HbF, HbAT87Q, and HbAT87Q+HbF, with increasing VCN, in patient-derived b0/b0 thalassemic erythroid cells untreated or treated with ALS10-T87Q, ATM1.1., left panel. Percentage of corresponding alpha aggregates, right panel. Statistical significance was assessed by computing means with one-way Anova test followed by a Tukey test to compare every mean with every other mean. All tests were done using GraphPad Prism software, version 7.0. software package was used for statistical analysis.
haematologica | 2021; 106(10)
2743
