
Page 196 - 2021_10-Haematologica-web
P. 196
B. van Dooijeweert et al.
C
D
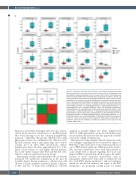
Figure 1. Univariate and multivariate analysis of untargeted metabolomics data from pyruvate kinase deficiency patients and healthy controls. (A) Heatmap of top 35 significant features identified by t-test (P-value cutoff =0.05). The heatmap was created using Euclidean ward clustering with autoscaling of features. (B) Top 20 important features represented as percentage identified by support vector machine classification. As isomers could not be distinguished using direct infusion high reso- lution mass spectrometry (DI-HRMS), the annotated numbers near the important fea- tures indicate the amount of isomers. In addition, letters in the footnote correspond to the following isomers: a) N8-acetylspermidine, b) 1,4-butanediammonium, c) 3- phosphoglyceric acid; 2-phospho-D-glyceric acid; (2R)-2-hydroxy-3-(phosphona- tooxy)propanoate, d) alanyl-glutamine; alanyl-γ-glutamate; glutaminyl-alanine; γ-glu- tamyl-alanine, e) MG(16:1(9Z)/0:0/0:0), f) asparaginyl-alanine; glutaminyl-glycine; glycyl-glutamine; glycycl-γ-glutamate; γ-glutamyl-glycine, g) N-acetyl-D-glucosamine; b- N-acetylglucosamine; N-acetyl-b-D-galactosamine; N-acetylmannosamine, h) N- acetyl-a-neuraminic acid, i) prolyl-asparagine. (C) Boxplots of each feature showing Z- scores for control and pyruvate kinase deficiency (PKD) groups, respectively. (D) Confusion matrix for the prediction of additional samples by the support vector machine (SVM) model.
limitations of machine learning models were also demon- strated by the incorrect classification of one PKD patient who was homozygous for the common p.(Arg510Gln) mutation.17 Clinically, this patient exhibited very mild phenotypic features. As confirmed by the clinical severity PLS-DA, patients with a mild phenotype and controls overlap most in their DBS metabolome (Online Supplementary Figure S4). Since approximately 30% of the initial cohort consists of such mildly affected patients, this could further explain why PCA and PLS-DA were unable to achieve separation between groups.
Interestingly, severely affected patients who are heavily transfused (>6 erythrocyte transfusions in the past 12 months) despite having undergone a splenectomy, still showed a clearly distinctive metabolic profile compared to HC and two of them were furthermore correctly
assigned as patients (Figure 1D; Online Supplementary Table S1). Although numbers are modest and further stud- ies are needed, this indicates that this approach is reliable even in the setting of transfusions.
Our approach using untargeted metabolomics provides novel insights regarding the broad metabolic impact of PKD that could be relevant to better understand the etiol- ogy of PKD-related symptoms. While glycolytic metabo- lites and their disturbance have been characterized to some extent, little is known regarding the broad scale impact of PKD on metabolism. In this respect, the identi- fication of novel distinctive metabolites, such as polyamines, which have been found to stabilize the red blood cell (RBC) plasma membrane,18 and acyl carnitines, which are involved in turnover and repair of the RBC membrane,19 are promising starting points for further
2724
haematologica | 2021; 106(10)
