
Page 187 - 2021_10-Haematologica-web
P. 187
HbF rescues dyserythropoiesis in SCD
for less than 1% of total hemoglobin30 and is restricted to a small subset of RBC (2%) called F-cells.31-33 In SCD, the expression of HbF is higher than in healthy individuals and varies considerably among patients. Although the mechanisms underlying increased expression of HbF are not completely elucidated, stress erythropoiesis and
preferential survival of F-cells in the circulation are sug- gested contributing factors.34-38 Our findings show that high HbF levels not only increase survival of circulating red cells but also play a role in the preferential survival of erythroblasts under physiologically relevant hypoxic conditions in the bone marrow.
AB
C
DE
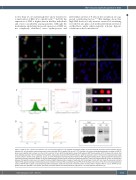
Figure 4. HSP70 and α-globin colocalization and co-immunoprecipitation. (A) Confocal microscopy images of control erythroid precursors under normoxia (CN) or hypoxia (CH), and of patient erythroid precursors under normoxia (PN) or hypoxia (PH) at day 7 (D7) of phase II of culture showing colocalization (in yellow) of HSP70 (green) and α-globin (red); nucleus is in blue (n=3); scale bar: 10 mm. (B) Proximity ligation assay (PLA) between HSP70 and α-globin at D7 of phase II of culture. Red spots indicate proximity (<40 nm) between both proteins. Spots were observed in PN and PH cultures, while no spots were seen in CN and CH. A representative image of each culture is shown (n=3); scale bar: 10 mm. (C) (Left) A histogram representing the intensity of APC signal generated by PLA, a gating of positive staining and saturated staining is indicated. (Middle) A dot plot representing an analysis mask using the compactness feature (x-axis) and intensity feature (y-axis) to discriminate between PLA-specific staining and non-specific staining. (Right) Representative images of each gate. (D) Percentage of cells (left) and mean fluorescence intensity (right) of PLA-specific staining in erythroid precursors of patient normoxia (PN) and patient hypoxia (PH) at D9 of phase II of culture (n=6). (E) Co-immunoprecipitation assay of HSP70 with α-globin using circulating sickle cell disease (SCD) red blood cells incubated under normoxia (PN) or hypoxia (PH) for 1 hour. HSP70 and α- globin bands are detected in the lysates (left panel) and after HSP70 immunoprecipitation (right panel). *P<0.05, Wilcoxon paired test (D).
haematologica | 2021; 106(10)
2715
