
Page 78 - 2021_09-Haematologica-web
P. 78
K.A. Rogers et al.
Details of the statistical analysis can be found in the Online Supplementary Methods.
Results
Patients, treatment, and disposition
In total, 60 patients were enrolled between March 23, 2016, and August 2, 2017. Their median age was 69.5 years (range, 43-88 years) and the median time from diag- nosis to first dose of study drug was 103.2 months (range, 10.3-307.9 months). Seventeen (28%) patients had del(17p) and 31 (52%) had Rai stage III or IV disease. The baseline patient and disease characteristics are shown in Table 1.
The median number of prior therapies was two (range, 1-10). All patients had taken ibrutinib previously, with 50 (83%) having received ibrutinib as monotherapy and ten (17%) having received ibrutinib in combination with another agent (Online Supplementary Table S1). Forty-three (72%) patients had been exposed to an anti-CD20 mono- clonal antibody and 36 (60%) had received prior systemic chemotherapy (Online Supplementary Table S1).
The median duration of ibrutinib treatment was 5.7 months (range, <1-55.5). Out of total of 60 patients, 15 (25%) received ibrutinib for <2 months. Of these 15 patients, only two discontinued acalabrutinib (due to squamous cell carcinoma of the lung and endometrial can- cer [n=1 each]). As ibrutinib treatment occurred before study entry, treatment response to ibrutinib was not fully captured for the entire patient population (safety, howev- er, was captured). The most common adverse events lead- ing to ibrutinib discontinuation were atrial fibrillation (23%), diarrhea (12%), arthralgia (10%), and rash (10%) (Online Supplementary Table S2). After ibrutinib discontinu- ation, the median time from taking the last dose of ibruti- nib to starting acalabrutinib was 7.5 months (range, 0.8- 31.1).
At a median follow-up of 34.6 months (range, 1.1-47.4), 29 (48%) patients remained on acalabrutinib; 45 patients (75%) had at least 1 year of treatment. The median time exposed to acalabrutinib was 32 months (range, 0.3-47.4). Of the 31 patients who discontinued acalabrutinib, the most common reason for discontinuation was disease pro- gression (n=14, 23%) followed by adverse events (n=10, 17%); other reasons were patient or physician decision (n=3 and n=3, respectively), and comorbid anorexia (n=1) (Figure 1). For the 14 patients who discontinued due to disease progression, 11 patients had an Eastern Cooperative Oncology Group performance status of 1, seven had Rai stage III-IV disease, and their median age was 72 years. Four of these 15 patients had del(17p), four had del(11q), and 12 had unmutated IGHV.
Efficacy
The ORR to acalabrutinib treatment was 73% (n=44/60; 95% confidence interval [95% CI]: 60-84%) (Figure 2). The ORR in patients with del(17p) was similar (71% [n=12/17]; 95% CI: 44-90%). The ORR including patients with PR with lymphocytosis (PRL) was 78% (n=47/60; 95% CI: 66-88%), comprising three (5%) patients with a CR, two (3%) with CRi, 39 (65%) with a PR, and three (5%) with a PRL. Of the 13 patients not achieving a response, four (7%) had stable disease (SD), one (2%) had PD; six (10%) patients were not evaluable for response
due to discontinuing treatment before the first response assessment at 3 months, and two (3%) were not available for response assessment. For the six patients who were not evaluable, three discontinued due to adverse events and three discontinued due to patient or physician deci- sion (1 and 2 patients, respectively) (Figure 1). The median DOR was not reached; the estimated 24-month DOR was 81% (n=44, 95% CI: 66-90%) and 78% (n=47, 95% CI: 63-88%) when patients with PRL were included, and the estimated 36-month DOR was 65% (95% CI: 46-79%) and 64% (95% CI: 45-77%) when patients with PRL were included (Figure 3A and B, respectively).
The median PFS was not reached; estimated 24-month and 36-month PFS rates were 72% (95% CI: 58-82%) and 58% (95% CI: 42-71%), respectively (Figure 4). The medi- an OS was not reached. Estimated 24-month and 36- month OS rates were 81% (95% CI: 68-89%) and 78% (95% CI: 65-87%), respectively (Figure 4). Sixteen (27%) patients started a subsequent treatment for CLL, and the median TTNT was 44 months (95% CI: 27-not estimable) (Online Supplementary Figure S1).
The efficacy (ORR, DOR, PFS) of acalabrutinib was also assessed by duration of previous ibrutinib treatment and by duration of treatment hold (time from ibrutinib discon- tinuation to start of acalabrutinib). These assessments were exploratory, and no statistical analyses were per- formed. The ORR was 64% (n=20/31; 95% CI: 45-81%) in patients who received prior ibrutinib treatment for ≥6 months and 83% (n=24/29; 95% CI: 64-94%) in those who received ibrutinib for <6 months. DOR and PFS on acalabrutinib in patients who received prior ibrutinib treatment for ≥6 months trended towards being shorter (no statistical analyses were performed) (Online Supplementary Figure S2 A, C, and E). Duration of treat- ment hold did not appear to affect ORR, DOR, or PFS dur- ing acalabrutinib treatment (Online Supplementary Figure S2 B, D, and F).
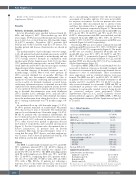
Table 1. Patient’s baseline. Characteristic
Age in years, median (range) Men, n (%)
ECOG PS ≤1, n (%)
Number of prior systemic therapies, n (%) 1
2 3 ≥4
β2-microglobulin >3 mg/L, n/N (%)
Genetic risk features, n/N (%) Unmutated IGHV
del(11q)a
del(17p)a
Rai stage III-IV, n (%)
Lymph nodes ≥5 cm, n (%)
Laboratory values, median (range) Lymphocyte count, 109/L Neutrophil count, 109/L Hemoglobin, g/dL
Platelet count, 109/L
N=60
69.5 (43-88) 38 (63) 58 (97)
14 (23) 18 (30) 11 (18) 17 (28)
46/58 (79)
46/58 (79) 14/60 (23) 17/60 (28)
31 (52) 19 (32)
12.3 (0.9-172.4) 3.3 (0.4-20.1) 12.2 (7.5-17.3) 117.5 (37-350)
aBy fluorescence in situ hybridisation testing. ECOG PS: Eastern Cooperative Oncology Group performance status; IGHV: immunoglobulin heavy chain gene.
2366
haematologica | 2021; 106(9)
