
Page 225 - 2021_09-Haematologica-web
P. 225
Letters to the Editor
CD59+ granulocytes and glycophorin A+ CD55– CD59– erythrocytes, respectively.
We diagnosed patients on the basis of a diagnostic flow- chart (Figure 1A) developed using published diagnostic cri- teria for specific IBMFS and acquired AA.6,7 The severity of cytopenia was determined according to the Camitta sever- ity criteria for AA.8 We divided the 133 patients into three groups: those with DC, those with non-DC IBMFS, and those with AA. All statistical analyses were performed using EZR (Saitama Medical Center, Jichi Medical University, Saitama, Japan).9 Written informed consent was obtained from patients or their legal guardians. This study was approved by the ethics committee of the Nagoya University Graduate School of Medicine.
Table 1 shows the clinical characteristics of patients included in this study. The median age at diagnosis of the total cohort was 7 years (range, 0-22 years). Of the 133 patients, 105, 24, and 4 were diagnosed with pancytope- nia, bicytopenia, and unilineage cytopenia (3 anemia and 1 thrombocytopenia), respectively. In patients with pan- cytopenia or bicytopenia, severity was assessed as very severe, severe, and moderate in 27, 35, and 67 patients, respectively. The median TL in all 133 patients was –0.96 SD (range, −5.73 to +4.00 SD). Using targeted sequenc- ing, in 24 patients (18%) we detected 35 pathogenic vari- ants (5 nonsense, 13 missense, 5 frameshift, 7 splice site, and 5 deletions) of known causative IBMFS genes, including TINF2 (n=6), TERT (n=3), FANCA (n=6),
A
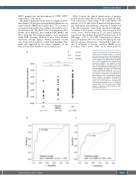
Figure 2. Comparison of peripheral blood lymphocyte telomere length in patients with bone marrow failure. (A) Comparison of standard deviations (SD) in telomere length (TL) in patients with dyskeratosis congenita (DC), non-DC inherited bone marrow failure syndromes (IBMFS), and aplastic anemia (AA). Kruskall-Wallis and Holm tests were used to investigate the relationships among the three groups. P-values < 0.05 were con- sidered statistically significant. (B, C) The cut-off values for TL were set according to the optimal combination of sensitivity and false positive rate (1-specificity) derived from receiver operating characteristic curves, which determined <−2.19 SD (very short TL) as the optimal TL threshold for evaluating DC patients, and <−1.71 SD (rel- atively short TL) for evaluating IBMFS patients, including non-DC patients. AUC, area under the curve.
BC
haematologica | 2021; 106(9)
2513
