
Page 123 - 2021_09-Haematologica-web
P. 123
A 3-gene signature in DLBCL
Figure 3. Survival curves according to MBN signature and multivariate analyses for overall survival. (A) Overall survival (OS) of the discovery cohort (R- HDS0305+DLCL04; n=186 patients) according to the MBN signature (MBN-Sig) showing significant differences in outcome between MBN-Sig low versus MBN-Sig high patient subsets. P-values were calculated with the log rank test. Frequencies of MBN-Sig high versus low cases in activated B-cells (ABC) and germinal center B cells/ unclassified (GCB/U) subsets in the discovery cohort are represented in the pie chart. (B) Forest plot depicting multivariate analyses for OS (discovery cohort). Only factors significantly asociated with OS in univariate analyses were considered. According to this analysis only the cell of origin (COO) as determined by NanoString-based targeted gene expression profiling (T-GEP) (COO_Nano), the MBN-Sig and the age adjusted international prognostic index (aaIPI) score retained statistical significance for OS, whereas MYC/BCL-2 DEXP_mRNA status, STAT3 and NFKBIA levels determined by T-GEP were not significantly associated with OS. HR: hazard ratio. (C) OS of the 469 patients treated with R-CHOP in the Sha’s cohort according to the MBN signature showing significant differences in outcome between MBN-Sig low versus MBN-Sig high patient subsets. P-values were calculated with the log rank test. Frequencies of MBN-Sig high versus low cases in ABC and GCB/U subsets in the Sha’s cohort are represented in the pie chart. (C) Forest plot depicting multivariate analyses for OS (Sha’s dataset), confirming the sig- nificant independent association with OS of the MBN-Sig in this large validation cohort.
Real life applicability of the MBN signature
In order to provide a risk stratification tool applicable to routine clinical practice in a prospective manner, we con- structed an RF model with the expression of genes charac- terizing the MBN signature. First, the classifier was trained on the discovery cohort splitting it into training (80%) and test (20%) dataset; in this case, the accuracy of the three- gene model was 93% in the training and 94% in test set. In order to confirm the reliability of this three-gene model, we further tested it in an independent dataset (validation set) consisting of the real-life cohort (n=102 cases). Of note, these cases were profiled with the same T-GEP panel and methods used in the discovery cohort, mitigating batch effects phenomena. As result, the three-gene model accu- rately classified 85% (87 of 102) cases as either MBN-Sig high or MBN-Sig low subgroups (Figure 4A). As reported in Figure 4B, the model effectively identified MBN-high and low categories with sensitivity (SE) and specificity (SP) of 94% and 76% respectively. Receiver operating characteris- tic (ROC) curve analysis revealed that the area under the curve (AUC) was 0.94 in the validation set (Figure 4C). Furthermore, this strategy produced a very efficient sur- vival prediction, which as expected showed a worse out- come for the MBN-high subset (Figure 4D) and mirrored the OS curve based on the median MBN value depicted in the Online Supplementary Figure S6B.
Correlation of the MBN signature with fluorescence in situ hybridization status and clinical variables
Focusing the analyses on our discovery cohort of 186 patients (DLCL04 and R-HDS0305 trials),34,35 we observed that the MBN signature significantly stratified the progno- sis GCB/U patients (Figure 5A). Since the MBN signature effectively stratified GCB/U DLBCL patients, we investi- gated correlations between the MBN-signature, FISH sta- tus and clinical variables in our discovery cohort. As shown in Figure 5B, we observed a significantly higher frequency of MYC and BCL-2 re-arrangements in the MBN-Sig high subgroup compared to the GCB/U MBN- Sig low subset. According to these observations, there was a significant enrichement of HG-BCL w/DH in the MBN- Sig high subgroup compared to the MBN-Sig low subset (Figure 5B; Online Supplementary Figure S7A). No differ- ences in the number of cases with missing FISH analyses were observed between groups (data not shown). In line with the literature,23,26,27 all these cases, except one, were GCB-derived (data not shown). As previously shown in Figure 3, ABC-derived DLBCL were significantly more represented in the MBN-Sig high subgroup (Figure 5B; Online Supplementary Figure S7A). Finally, no significant differences in the aaIPI score (intermediate high vs. high) were observed between groups (Figure 5B; Online Supplementary Figure S7A). These findings were validated in silico in the larger cohort from Sha et al.27 (Figure 5C and D). As observed in the discovery cohort, the MBN signa-
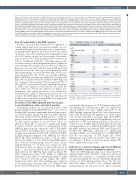
Table 2. Univariate analysis for overall survival.
aaIPI Intermediate-High High
COO Nano GCB
ABC Unclassified
ASCT No
Yes
MYC-BCL-2 DEXPmRNA No
Yes
STAT3
Low High
NFKBIA
Low
High
Hazard Ratio
Ref 2.04
Ref 3.39 1.17
Ref 0.88
Ref 2.32
Ref 0.37
Ref
0.34
95% CI
1.10-3.78
1.76-6.52 0.47-2.96
0.47-1.63 1.26-4.29
0.19-0.7
0.17-0.68
P
0.023
<0.001 0.736
0.68 0.007
0.004 0.002
Signif: significance; ref: reference; IPI: international prognostic index; COO: cell of ori- gin; COO_Nano: COO defined by NanoString; ASCT: autologous stem cell transplant; MYC/BCL-2 DEXP_mRNA: double expressor status defined by NanoString: CI: Confidence Interval. *P<0.05; **P<0.01.
ture stratified the prognosis of GCB/U patients (Figure 5C) and identified the vast majority of DH cases. Again ABC- derived DLBCL were more highly represented in the MBN-Sig high subgroup (Figure 5D; Online Supplementary Figure S7B). In this study, the application of a gene expres- sion classifier identified a molecular high grade (MHG) subgroup strongly enriched in DH lymphomas and com- prising 9% of the total patient population.27 In order to evaluate how our MBN signature performed in the same patient population, we compared the MBN signature with the MHG signature and with the FISH status (Figure 5C). Notably the MBN-high subgroup was significantly enriched in MHG cases, identifying 76% of MHG DLBCL and the vast majority of DH (Figure 5D; Online Supplementary Figure S7B). Also in this cohort there were no differences in IPI score between groups (Figure 5D; Online Supplementary Figure S7B).
Rationale for a precision therapy approach in MBN-Sig high-risk diffuse large B-cell lymphoma patients
Since the MBN-Sig high subgroup is characterized by relatively higher MYC and BCL-2 expression and lower NFKBIA levels indicative of constitutive NF-kB activity, we next investigated the effect of differential therapeutic strategies in this high-risk patient subset. We first ana- lyzed the impact of ASCT versus standard chemoim- munotherapy in the discovery cohort. ASCT consolida-
haematologica | 2021; 106(9)
2411
