
Page 113 - 2021_09-Haematologica-web
P. 113
Mutations in ET treated with imetelstat
Table 2. Clinical outcome data.
All (n=18)
18 (100%) 16 (89%) 10 (63%)
3 (19%) 18.4 (6.9-36.7) 18.3 (2.4-31.3) 3 (17%)
3 (17%)
6 (33%)
4 (31%)
Noadditionalmutations Withadditionalmutations P
Hematologic response
Hematologic complete response
Major molecular responsea
Partial molecular responsea
Median duration of treatment, months, (range) Median duration of response, months (range) Thromboembolic event
Transformation to myelofibrosis
Loss of hematologic response
Loss of molecular responseb
(n=9)
9 (100%)
8 (89%)
5 (63%)
1 (13%) 23.5 (7.8-36.7) 22.4 (3.8-31.3) 1 (11%)
1 (11%)
2 (22%)
0
(n=9)
9 (100%) n.s. 8 (89%) n.s. 5 (63%) n.s. 2 (25%) n.s.
16.6 (6.9-28.9) n.s. 14.5 (2.4-29.8) n.s. 2 (22%)c n.s. 2 (22%) n.s. 4 (44%) n.s.
an=16 for this analysis: two patients with no driver mutation were excluded; bn=13 for this analysis: two patients with no driver mutation and three patients with no molecular response were excluded; cone patient with two thromboembolic events. n.s.=not statistically significant.
4 (57%)
0.025
Loss of response was associated with thromboembolic events (3/4 events unrelated to therapy), resistance to ime- telstat treatment or progression to myelofibrosis. Transformation to myelofibrosis occurred in two patients with additional mutations during follow-up and 6 months after treatment termination (#4 and #17, respectively). The former, a CALR-mutated patient, carried five additional mutations in DNMT3A, EZH2, SF3B1, TET2 and TP53, and the latter, a JAK2-mutated patient, had an ASXL1 and a late-emerging TET2 mutation. On retrospective evalua- tion, none of the patients fulfilled the criteria for prefibrot- ic myelofibrosis according to the newer WHO 2016 crite- ria.
Discussion
This is the first report on the mutational repertoire of refractory and/or intolerant ET patients after one to four prior therapies. Following treatment with imetelstat, a first-in-class, specific telomerase inhibitor, all patients achieved hematologic responses, and significant molecular responses were seen within 3-6 months, i.e., 63% and 19% of patients with driver mutations reached MMR or PMR, respectively.
At study entry, 50% of patients carried one to five somatic mutations in addition to the phenotypic driver mutation, including one triple-negative case. This frequen-
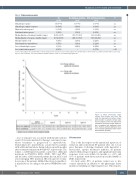
Figure 3. Mean phenotypic driver mutant allele burden over time. The solid line represents the driver mutant allele burden in patients without addi- tional mutations (n=8). The dashed line represents the driver mutant allele bur- den in patients with additional muta- tions. Patients without additional muta- tions reached significantly lower mutant allele burdens (P=0.04).
haematologica | 2021; 106(9)
2401
