
Page 238 - 2021_06-Haematologica-web
P. 238
Letters to the Editor
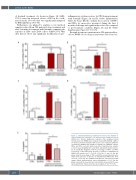
of ibrutinib treatment. As shown in Figure 1E, SARS- CoV-2 caused an increased release of IL-6 in the condi- tioned media (*P<0.05) that was significantly mitigated by BTK inhibition (*P<0.05).
Furthermore, we planned to analyze ex vivo matched samples isolated from CLL patients before treatment and after 3 months of treatment with ibrutinib comparing the response of CD3+ and CD14+ cells to SARS-CoV-2. Our data did not show any significant modification in pro-
inflammatory cytokines release by CD3 during treatment with ibrutinib (Figure 2A and B; Online Supplementary Figure S2; P=ns). On the contrary, the secretion of TNF-α and IFN-γ by monocytes measured during the first 3 months of therapy was significantly reduced as compared to pre-treatment condition (Figure 2C and D; Online Supplementary Figure S2; *P<0.05).
Ibrutinib treatment continuation in CLL patients affect- ed by COVID-19 is feeding an important clinical and sci-
AB
CD
E
Figure 1. Immunomodulatory modifications induced by ibrutinib in chronic lymphocytic leukemia T cells and monocytes during infection by SARS-CoV-2. Chronic lymphocytic leukemia (CLL) peripheral blood mononuclear cells (PBMC) were isolated, treated with ibrutinib 1 mM for 90 minutes and then stimulated with severe acute respiratory syndrome coronavirus 2 (SARS-CoV-2) peptides (1 mg/mL) for additional 6 hours. TNF-α and IFN-γ secretion levels have been determined by cytokine secretion assay kit gating CD3+ and CD14+ populations by flow cytome- try. (A and B) Bar diagrams show the percentage of TNF-α and IFN-γ secretion by T cells either in the presence or absence of stimulation by SARS-CoV-2 peptides (n=7; *P<0.05,**P<0.01). (C and D) Bar dia- grams show the percentage of TNF-α and IFN-γ secretion by monocytes either in the presence or absence of stimulation by SARS-CoV-2 (n=7; *P<0.05; **P<0.01). (E) Conditioned media were collected for human enzyme linked immunosorbent assay determination of IL-6. Bar dia- grams represent the mean protein concentration measured in 11 sepa- rated experiments. Values presented are in pg/mL (n=11, *P<0.05).
2266
haematologica | 2021; 106(8)
