
Page 178 - 2021_06-Haematologica-web
P. 178
S. Warsi et al.
AB
CD
EF
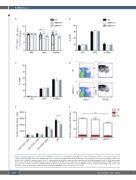
Figure 2. Normal steady state hematopoiesis in BMPR-II deficient mice. (A) Peripheral blood (PB) cell counts of adult mice (n=3-9). Y-axis indicates number of cells per L (liter) PB. RBC: red blood cell; WBC: white blood cell. (B) Lineage distribution in PB of adult mice at steady state by flow cytometry analysis. CD3: T cells; B220: B cells; Gr1/Mac1: myeloid cells (n=3-10). (C) Lineage distribution in BM of adult mice at steady state by flow cytometry analysis (n=3-10). (D) Representative fluorescence activated cell sorting (FACS) plot of an LSK-SLAM stain of BM cells from adult mice. (E) Quantification of LSK-SLAM populations in BM of adult mice at steady state. Number of LSK cells: 54,341±4,939 for wild-type (WT) (n=8) vs. 41,052±3,398 for BMPR-II-/- (n=10). (F) BM colony forming assay in vitro. Total number of colonies: 111.5±5.07 for WT (n=8) vs. 86.2±3.37 for BMPR-II-/- (n=10). *P<0.05; *** P<0.001.
2206
haematologica | 2021; 106(8)
