
Page 71 - 2021_07-Haematologica-web
P. 71
TBI versus non-TBI regimens for de novo AML
TBI regimens (n=57) or non-TBI regimens alone (n=53). Only 14 centers used TBI-containing regimens alone. Further, between 2012 and 2016, only a third of transplants used TBI-containing regimens. Non-TBI regimens were equally likely to be used between 2008 and 2011 and between 2012 and 2016. The median follow-up of patients who received TBI-containing regimens was 63 months (range, 3-122 months) and for those who received non-TBI regimens, 50 months (range, 3–122 months).
Hematopoietic recovery
The median time to neutrophil recovery was 20 days and 17 days after TBI-containing and non-TBI regimens, respec- tively (P=0.04). The corresponding time to platelet recovery were 38 days and 30 days, P=0.002. Consequently, the day- 28 incidence of neutrophil recovery was lower after TBI- containing (79%, 95% Confidence Interval [CI]: 73–84) compared to non-TBI regimens (85%, 95% CI: 82–88), P=0.04. Similarly, day-100 incidence of platelet recovery was also lower after TBI-containing (81%, 95% CI: 75–86) compared to non-TBI regimens (87%, 95% CI: 84–90), P=0.002.
Acute and chronic graft versus host disease
Grade 2-3 acute GvHD risk was higher with TBI-contain- ing compared to non-TBI regimens (Table 2). The day-100 incidence of grade 2-3 acute GvHD were 56% (95% CI: 49– 63) and 27% (95% CI: 22–30), respectively, P<0.0001. Compared to HLA-matched sibling donors, risks were higher with HLA-matched unrelated (hazard ratio [HR] 3.03, 95% CI: 1.75–5.25, P<0.0001), HLA-mismatched unrelated (HR 4.12, 95% CI: 2.18–7.77, P<0.0001), HLA- matched cord blood (HR 3.02, 95% CI: 1.44 –6.34, P=0.0035) and HLA-mismatched cord blood (HR 2.95, 95% CI: 1.57–5.56, P=0.0008). Grade 3-4 acute GvHD risk did not differ between the treatment groups (Table 2). Compared to bone marrow grafts, risk of acute GvHD was higher with peripheral blood (HR 3.22, 95% CI: 1.72–6.03, P=0.003) and cord blood (HR 2.24, 95% CI: 1.29–3.88, P=0.0041). Chronic GvHD risk also did not differ between treatment groups (Table 2). The 5-year incidence of chronic GvHD was 37% (95% CI: 30– 44) and 30% (95% CI: 26– 35) after TBI-containing and non-TBI regimens. Chronic GvHD risks were higher in patients aged 11–21 years com- pared to those aged ≤3 years (HR 1.78, 95% CI: 1,13–2.81,
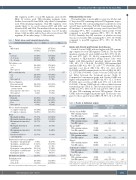
Table 1. Patient, disease and transplant characteristics.
Variable
Sex Male/female
Age
≤ 3 years
4 – 10 years
11 – 21 years
TBI- regimens
101 (51%) / 98 (49%)
33 (17%) 49 (25%) 117 (59%)
168 (84%) 26 (13%) 5(3%)
172 (86%) 25 (13%) 2( 1%)
132 (66%) 52 (26%)
12(6%) 3(2%)
29 (15%) 123 (62%) 41 (21%) 6(3%)
107 (54%) 92 (46%)
17(9%) 34 (17%) 14(7%)
21 (11%) 101 (51%) 12 ( 6%)
Non-TBI regimens
217 (51%) / 208 (49%)
137 (32%) 93 (22%) 195 (46%)
376 (88%) 47 (11%) 2 (<1%)
375 (88%) 43 (10%) 7(2%)
295 (69%) 84 (20%)
29(7%) 17(4%)
36(8%) 285 (67%) 90 (21%) 14(3%)
277 (65%) 148 (35%)
123 (29%) 109 (26%) 32(8%)
29(7%) 99 (23%) 33(8%)
42 (10%) 139 (33%) 8(2%) 77 (18%) 115 (27%) 44 (10%
221 (52%) 192 (45%)
233 (55%)
P-value 0.94
<0.001
0.06
0.55
0.14
0.14
0.006
Performance score 90-100
≤80
Not reported
HCT co-morbidity index ≤2
≥3
Not reported
Site(s) at diagnosis
Bone marrow only Bone marrow + central
nervous system
Bone marrow + other sites Not reported
Cytogenetic risk Favorable Intermediate Poor
Not reported
Disease status at transplant 1st complete remission 2nd complete remission
Donor
HLA-matched sibling HLA-matched unrelated donor HLA-mismatched unrelated
donor
HLA-matched unrelated
cord blood HLA-mismatched unrelated
cord blood Unrelated cord blood
(not reported)
Table 2. Results of multivariate analysis Outcome Events/
Hazard Ratio (95% CI)
1.00
0.44 (0.33 – 0.58)
1.00
P-value
<0.0001
Grade 2-4 acute GvHD* TBI-containing regimen Non-TBI regimen
Grade 3-4 acute GvHD TBI-containing regimen Non-TBI regimen
Chronic GvHD* TBI-containing regimen Non-TBI regimen
Non-relapse mortality║ TBI-containing regimen Non-TBI regimen
Relapse#
TBI-containing regimen Non-TBI regimen
Leukemia-free survival** TBI-containing regimen Non-TBI regimen
Overall survival║ TBI-containing regimen Non-TBI regimen
Number
109/196 112/420
34/196
53/420
70/198 116/422
42/199
46/425
43/199 149/425
85/199
195/425 73/199
159/425
0.69 (0.44 – 1.08) 0.10
1.00
0.82 (0.59 – 1.13) 0.23
1.00
0.53 (0.35 – 0.81)
0.003
Graft versus host disease prophylaxis Tacrolimus + mycophenolate
<0.001
<0.001 <0.001
Tacrolimus + methotrexate Tacrolimus alone` Cyclosporine + mycophenolate Cyclosporine + methotrexate Cyclosporine alone`
Anti-thymocyte globulin
Transplant period 2008 – 2011 2012 – 2016
7 ( 4%) 40 (20%) 4 ( 2%) 119 (60%) 20 (10%) 9 ( 5%)
22 (11%) 133 (67%)
66 (33%)
1.00
1.46 (1.04 – 2.07) 0.03
1.00
1.01 (0.78 – 1.31) 0.95 1.00
0.98 (0.74 – 1.30) 0.91
GvHD: graft versus host disease; TBI. total body
body irradiation; *adjusted for age, donor type
♯adjusted for age and site(s) at diagnosis and **adjusted for age and cytogenetic risk.
irradiation: CI: Confidence Interval; TBI: total and GvHD prophylaxis; ║adjusted for age;
TBI: total body irradiation; HCT: hematopoietic cell transplant.
haematologica | 2021; 106(7)
1841
