
Page 244 - 2021_07-Haematologica-web
P. 244
Letters to the Editor
complex involved in protein turnover regulation, were the most significantly enriched sgRNA in the presence of continued IMiD exposure (Figure 1E; Online Supplementary Figure S1D to E), validating previously pub- lished data.5,6 Gene ontology (GO) analysis and protein-
protein interaction (PPI) networking revealed that CSN may also modulate CUL4-DDB1 functions in response to DNA damage (Online Supplementary Figure S1F and G). Notably, some sgRNA (NCOR1, EDC4, SCAP, UBE2G1, MBTPS1/2) conferred selective resistance to LEN but not
A B
CD
EF
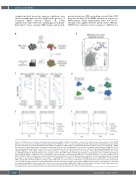
Figure 2. TOP2B deletion synergizes with Thalidomide analogues (IMiD) in MM.1S and MM.1S resistant cells. (A) Schematic representation of the CRISPR genome-scale dropout screen workflow. Approximately 500x106 MM.1Sres-Cas9 cells were transduced with the Brunello genome-wide library, selected with puromycin and then treated with dimethyl sulfoxide (DMSO), lenalidomide (LEN) (2 mM) or pomalidomide (POM) (500 nM) for 3 weeks. Genomic DNA (gDNA)
(P-value) of negatively enriched guides in MM.1Sres-Cas9 ) at the end of the screen (T-End) of short guide RNA (sgRNA) specific for TOP2B in MM.1Sres. In the DMSO condition, the counts in T-End are compared to a timepoint zero (T-0) reference. In the LEN and POM conditions, the counts for sgTOP2B in T-End are plotted relatively to the average counts in the DMSO T-End condition. (D) Schematic representation of the competitive proliferation assay workflow. MM.1S- or MM.1Sres-Cas9 scramble-BFP cells were grown in competition with MM.1Sres-Cas9 sgTOP2B-GFP at a 1:1 ratio in DMSO, LEN (2 mM) or POM (500 nM) to validate the data observed in the genome-wide dropout screen. (E) Representative experiment of n=3 independent replicates showing the change in percentage of MM.1Sres-Cas9 scramble- or sgTOP2B-GFP+ cells grown in competition with MM.1Sres-Cas9 Scramble-BFP+ cells treated with DMSO, LEN (2 mM) or POM (500 nM) for 21 days. Each dot with relative error bars represent the mean ± standard deviation of values from two technical repli- cates. (F) Representative experiment of three independent replicates showing the change in percentage of MM.1S-Cas9 scramble- or sgTOP2B-GFP+ cells grown in competition with MM.1S-Cas9 scramble-BFP+ cells (at a 1:1 ratio) treated with DMSO, LEN (2 mM) or POM (500 nM) for 10 days. Each dot with relative error
was extracted for library prepraration and Illumina sequencing. (B) Scatter plot overlapping the -log
cells treated with LEN and POM at the end of the screen. (C) Normalized counts (in log
bars represent the mean ± standard deviation of values from two technical replicates. GFP: green fluorescent protein.
2
10
2014
haematologica | 2021; 106(7)
